


 Program Overview
The Alliance of Downriver Watersheds (ADW) Chemistry and Flow Monitoring Program, formerly the Water Quality Monitoring Program, was developed in 2012 as a collaborative effort to collect environmental data on South Ecorse Creek, the Lower Huron River, and the Combined Downriver waterways . The data are intended to lead to a better understanding of pollution contributions from non-point sources in the Downriver watershed and, in turn, help the local municipalities focus and track pollution reduction efforts.
Results Summary
The following general conclusions can be drawn from the analysis of the data collected under the Alliance of Downriver Watersheds Chemistry and Flow Monitoring Program from 2012 through 2019:
- Total Phosphorus: Phosphorus concentrations are well above target levels across sites throughout the ADW, but 2019 was the lowest mean concentration on record. Despite the 2019 result, there is no measurable trend in TP concentrations overall. Sites in the Lower Huron River watershed are 24% lower than the other two watersheds, and Woods Creek has the lowest TP concentrations overall. Based on TSS results (see below), the high TP concentrations are likely entering streams dissolved in runoff, rather than through streambank or other erosion.
- Bacteria (E. coli): Summary to come!
- Total Suspended Solids (TSS): TSS concentrations are generally low, exceeding the target threshold only 3% of the time. This suggests relatively stabilized stream banks and channels. Periodic erosion may occur at low levels in creeks during rain storms.
- Dissolved Oxygen: Summary to come!
- Conductivity: Summary to come!
- Macroinvertebrates: Summary to come!
Site Locations
Data are collected from stream and river locations that facilitate the establishment of relationships between land cover and ecological stream health. The locations are selected based on their use by the Michigan Department of Environment, Great Lakes, and Energy, the HRWC Adopt-A-Stream volunteer stream monitoring program, likelihood of significant sub-watershed phosphorus loading based on modeling, and capturing the range of sub-watershed and upstream conditions.
The program monitors annually during the growing season (April through September) at nine long-term sites throughout the ADW. Long-term sites help determine changing conditions over time. The program also monitors at investigative sites located upstream of selected long-term sites. Investigative sites provide useful data to gain a better understanding of upstream conditions regarding pollutant sources and are usually only sampled for one monitoring season.
Chemistry and Flow Monitoring was conducted in 2019 at thirteen sites across seven creeksheds, including Frank & Poet, Brownstown, Blakely , South Ecorse, Woods, Silver and Smith creeks. During the 2019 monitoring season, four of the thirteen monitoring sites were investigative sites. For more information about the sites, please see the map below. Orange and purple sites indicate investigative sites, with green markers reflecting long-term sites.
Alliance of Downriver Watersheds Chemistry and Flow Monitoring Sites
Parameters
Total Phosphorus (TP)
Phosphorus is an essential nutrient for all aquatic plants. It is needed for plant growth and many metabolic reactions in plants and animals. In southern Michigan, phosphorus is typically the growth-limiting factor in fresh water systems. That is, if all the phosphorus present is used, then plant growth will cease no matter how much nitrogen is available. Total Phosphorus (TP) is a measure of all forms of phosphorus present in a water sample, and is the primary indicator of overnutrification in the middle Huron River watershed. The typical background level of TP for a Michigan river is 0.03 mg/L or ppm. The TMDL established for Ford and Belleville Lakes sets goals of 0.05 mg/L at Ford Lake and 0.03 mg/L at Belleville Lake.
Further, phosphorus is the main parameter of concern in eutrophic lake and stream systems for its role in producing blue-green algae. Phosphorus enters surface waters from point sources of pollution, such as wastewater treatment plants, and nonpoint sources of pollution, including natural, animal and human sources. Excessive concentrations of this element can quickly lead to extensive growth of aquatic plants and algae. Abundant algae and plant growth can lead to depletion of dissolved oxygen in the water, and, in turn, adversely affect aquatic animal populations and cause fish kills. This nuisance algal and plant growth interferes with recreation and aesthetic enjoyment by reducing water clarity, tangling boat motors, and creating unpleasant swimming conditions, foul odors, and blooms of toxic and nontoxic organisms.
Total Suspended Solids (TSS)
Total suspended solids include all particles suspended in water which will not pass through a filter. As levels of TSS increase in water, water temperature increases while levels of dissolved oxygen decrease. Fish and aquatic insect species are very sensitive to these changes which can lead to a loss of diversity of aquatic life. While Michigan’s Water Quality Standards do not contain numerical limits for TSS, a narrative standard requires that waters not have any of these physical properties: turbidity; unnatural color; oil films; floating solids; foam; settleable solids; suspended solids; and deposits. Water with a TSS concentration <20 mg/L (ppm) is considered clear. Water with levels between 40 and 80 mg/L tends to appear cloudy, and water with concentrations over 150 mg/L usually appears muddy. In streams that have shown impairments to aquatic life due to sedimentation, TSS is used as a surrogate measure for Total Maximum Daily Load (TMDL) regulation, since large amounts of sediment can bury potential habitat for aquatic macroinvertebrates. This is the case for Malletts Creek and Swift Run TMDLs. Those evaluations set the following targets for TSS:
- Optimum = < 25 mg/l
- Good to Moderate = >25 to 80 mg/l
- Less than moderate = >80 to 400 mg/l
- Poor = >400 mg/l
Suspended solids may originate from point sources such as sanitary wastewater and industrial wastewater, but most tends to originate from nonpoint sources such as soil erosion from construction sites, urban/suburban sites, agriculture and exposed stream or river banks.
Bacteria (E. coli)
Escherichia coli (E. coli) counts are measured from water samples as a broad indicator of the presence of pathogens found in the digestive tracts of warm-blooded animals. Their presence may indicate the presence of sewage or wastewater, but high counts can also result from other animal sources. These generalized bacterial counts are not specific enough to be directly indicative of health risks. However, consistently high levels serve as a warning of potential health risks and warrant further investigation to determine the source of bacterial outbreaks. The State of Michigan water quality standard for partial body contact is a monthly average of 130 counts per 100ml of water, while a single sampling event for waters protected for full body contact is <300 E. coli counts per 100 ml of water. Several reaches in the middle Huron are on the state’s list of impaired waters due to bacterial contamination, including Honey Creek, and drainages to and including the Huron River between Argo and Geddes Dams.
Dissolved Oxygen (DO)
Most aquatic plants and animals require a certain level of oxygen dissolved in the water for survival. Dissolved oxygen (DO) is a measure of the amount of gaseous oxygen (O2) in the water, which enters water from the atmosphere via aeration or as a waste product of plant photosynthesis. DO levels drop to very low levels in warm, stagnant water, whereas fast-flowing, cooler water generally has high concentrations of DO. Some forms of pollution can also provide conditions that impact DO levels. For example, excess nutrients such as phosphorus and nitrogen can result in reductions in DO levels, which can be detrimental to certain species of aquatic insects. Normal DO values in Michigan waters ranges between 5 to 15 mg/L. The statewide minimum water quality standard is 5 mg/L. However, concentrations change throughout the day and night due to air and water temperature changes, photosynthesis, respiration and decomposition.
Temperature
Water temperature dictates what aquatic life will inhabit waterways and controls the dissolved oxygen content of water (as the temperature of water increases, the concentration of dissolved oxygen content decreases). It also influences the rate of both chemical and biological reactions.
Conductivity
Conductivity is a measure of the ability of water to pass an electrical current, and is a general measure of water quality. It indicates the presence of inorganic dissolved solids, such as sulfates, nitrates, phosphates, and salts. Conductivity is affected by temperature: the warmer the water, the higher the conductivity. Conductivity in surface waters is affected primarily by the geology of the area through which the water flows. In Michigan, values for a healthy river or stream habitat range between 100 and 800 µS/cm. Low values are characteristic of oligotrophic (low nutrient) lake waters, while values above 800 µS/cm are characteristic of eutrophic (high nutrient) lake waters where plants are in abundance. There are a number of potential sources of minerals and some natural variation, but consistent results above 800 µS would be unexpected from natural sources. Anthropogenic sources can include winter road salts, fertilizers, and drinking water softeners.
Water Velocity/Flow
Measuring water velocity at the long-term monitoring sites, along with collecting water samples that are analyzed for nutrient concentration, allows for calculating the “load” of a particular nutrient for a specific moment in time. A “load” is a measure of the amount of a substance entering a water body, usually expressed as pounds per year. Concentration, when coupled with stream discharge, can be used to estimate the export rates of phosphorus (or other nutrients) for the sub-watershed, and to estimate the loading rates of phosphorus in receiving waters.
Methodology
The procedures used in this monitoring program have been reviewed and approved by the Michigan Department of Environment, Great Lakes, and Energy (EGLE). Complete procedures are documented thoroughly in the program’s Quality Assurance Project Plan (QAPP). The QAPP was originally developed at the beginning of the program in 2012, and revised and approved by DEQ in 2019. The following is a summary of those methods and procedures.
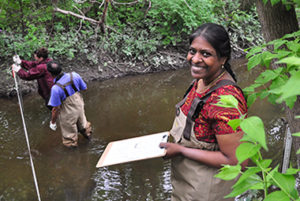
Stream monitoring was conducted twice monthly from April through September at the designated monitoring sites described above. The volunteer monitoring teams travel to sites and first complete a field datasheet that documents the location, date, time, team members and weather conditions for the current and previous days. The field datasheet also is used to record information about the water samples and the water quality measurement results. If stream flow was also measured during a field outing, a separate stream flow datasheet was filled out to record that activity and velocity measurements. Upon completion of the fieldwork, the monitoring team delivered water samples to the Ann Arbor Water Treatment Plant Laboratory.
Sample Collection Methodology
Collection of water samples was completed first at each site to minimize the disturbance of the stream substrate, which could artificially raise the amount of suspended matter in the water column. For all samples, the team member followed the same “grab” sampling protocol in accordance with the method prescribed in the 1994 MDEQ field procedures manual for wadeable streams.
In-stream samples were collected upstream and at arm’s length from where the team member was standing. Where stream depth permitted, water was taken from the middle of the water column and in the middle of the stream cross-section. The bottles were rinsed three times with stream water prior to taking the baseline sample. Samples were labeled and placed in a cooler with ice packs until they were delivered to the laboratory for analysis.
Baseline samples were collected to measure Total Phosphorus (TP), Total Suspended Solids (TSS), and E. coli. HDPE plastic bottles were used for TP and TSS samples. If TP samples could not be analyzed within the method-specified holding period after delivery to the lab, they were treated with preservative.
In-Stream Chemistry Monitoring Methodology
Six water quality chemistry parameters were routinely measured at all sites. Water quality measurements for water temperature, dissolved oxygen, conductivity, total dissolved solids, pH, and chloride were made using two YSIs. For all measurements, the instruments were placed in the water at the appropriate submerged level at arm’s length distance and upstream from the team member. The results were read from the digital displays and recorded on the field data sheet.
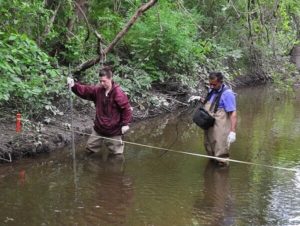
Flow Monitoring Methodology
Water velocity was measured directly in the stream after water samples were collected and water quality testing was completed. Flow was measured at each long-term site by team members across a range of measured water levels. Where stream discharge instrumentation or a water level gage was in place, discharge measurements can be charted against water level to establish a “rating curve.” Once established, the rating curves were used to estimate discharge from water level observations. A USGS water-level sensors is located at Ecorse Creek, and a sensor node managed by HRWC is also installed at Ecorse Creek.
Results by Subwatershed
Total Phosphorus
Total Phosphorus concentrations are high across the entire ADW. For the entire period of monitoring record (2012-19), all long-term sites have concentration ranges with mean and median levels above typical background levels (0.03 mg/l) and the stream target for ADW streams (0.05 mg/l). Four sites (Blakely, Brownstown, N. Ecorse and Silver Creeks) have a mean TP concentration that is more than twice the stream target and others are close to that level.
2019 was a bit better than average. Most sites still had average concentrations for the year that were above the stream target, but they do not exceed the target by as great a degree as past years. Together, the sites had a mean phosphorus concentration of 0.082 mg/l in 2019, which was the lowest overall mean year on record and a 0.057 mg/l decrease from 2018. The Ecorse Creek and Combined Downriver watersheds had similar mean TP concentrations in 2019. Ecorse Creek sites average 0.092 mg/l and Combined Downriver sites average 0.088 mg/l. Lower Huron sites (not including the Huron River site in Rockwood) were 24% lower than the other two watersheds with a mean TP concentration of 0.068 mg/l. Including the river site, the Lower Huron mean concentration was 0.064 mg/l.
There is no observable trend in phosphorus concentrations across the ADW watersheds. While 2019 had the lowest mean and median TP concentration on record, it followed the highest in 2018. Year to year, TP concentration ranges fluctuate around the long-term average of 0.10 mg/l, or twice the ADW stream target. There are no significant TP concentration trends for any of the three watersheds either.
As typical with previous years, there appears to be monthly variation in TP data. Phosphorus levels were relatively low when the outdoor temperatures were still cool, even though flows may be higher. Concentrations then vary throughout the summer, but higher concentrations tend to occur in September.
Total Suspended Solids
All long-term sites had mean TSS concentrations below “moderate” threshold for the 2019 season and for the overall period of record (2012-2019). In fact, all sites have mean TSS concentrations below 40 mg/l. Some sites had average TSS in the optimum range (< 25 mg/l). The higher individual sample results were a consequence of some highly turbid waters that were monitored following rain events. Runoff or erosion from these storms generated suspended solid levels over 100 mg/l at five sites. However, four sites never exceeded the 80 mg/L threshold all year.
TSS concentrations measured at the nine stream sites throughout the ADW occasionally exceeded 80 mg/l during monitoring. Out of 813 measurements over eight years, the TSS threshold was exceeded only 26 times (3.2%). The 80 mg/l threshold was exceeded 5 times out of 107 samples (4.6%) in 2019. Generally, TSS levels are quite low, and even in storm conditions the streams exceed the threshold by a small amount. However, the storm sediment content may indicate that erosion or soil runoff may be occurring during storm events throughout the ADW.
Sediment-phosphorus relationship
All but one of the sampling sites showed some relationship between phosphorus and sediments, but the degree of correlation was variable between sites. Looking at all data points between 2012 and 2014, correlations between TP and TSS ranged from 0.0025 on the low end (Woods Creek, ADW06) to 0.76 (Blakely and S. Ecorse Creek). The low correlation at Woods Creek was mainly due to a very high TSS concentration that may be an anomaly. Removing that data point brings the correlation to 0.68 for Woods Creek. The next lowest correlation is 0.35 (Smith Creek). These results suggest that erosion (sediment-bound TP) is a contributing factor to elevated TP levels in ADW streams, and management techniques to reduce erosion should continue to be considered. Figure 14 below illustrates the variability of the TP/TSS relationship across all the ADW sites in Wayne County.
Bacteria
Figure 17 below represents the E.coli results for each of the monitoring sites. The majority of the samples over the 7-year monitoring record across all sites significantly exceeded the state water quality standards for full-body contact, and many samples exceed the partial-body contact standard – in some cases by multiple orders of magnitude. Exceptions are Woods Creek and the Huron River, which consistently had lower levels of E.coli. In 2019, Woods Creek met the full body contact standard for all but three samples, and the Huron River never exceeded the standard. These waters have good natural riparian cover, which may filter bacteria sources before they enter surface waters. Over time, annual bacteria concentrations in ADW waters have increased (see Figure) such that mean concentrations across ADW sites exceeded even the partial body contact standard each of the last three years.
Conductivity
The conductivity results are presented for all sites over the monitoring season in a similar fashion as was done for dissolved oxygen (see Figure 19). The mean values for conductivity exceeded the upper limit for healthy waters (800 µS) for all but one of the monitoring sites. Woods Creek, which, as noted earlier, runs through the Lower Huron Metro Park, had a mean value of 538 µS, in between the range of the previous two years. The remaining sites sampled all experienced periods of conductivity well over 1,000 µS. Further, six of eight sites are showing increasing trends in median conductivity for the year. This suggests that whatever the source of pollution is, it is increasing in concentration or volume. Further investigation may be needed to determine what specific contaminants are contributing to these high conductivity levels.
It is noteworthy that Woods and Smith Creeks are the only monitoring sites that are not located near heavily traveled roads, connecting urban and suburban areas or are commercial routes between major highways. It was surprising that Smith Creek had such highly elevated conductivity measures, as the location of the monitoring site is downstream of a long stretch of the tributary that runs through wooded land with good riparian buffers.
Dissolved Oxygen
The graph below (Figure 18) depicts the DO levels measured over the 2012 – 2014 monitoring seasons. Compared to only three sites in 2012, six of the eight sites in 2013 consistently had DO levels above the state minimum standard for healthy waters, and half of them did in 2014. DO levels at sites in Brownstown, N. Ecorse, Silver and Silver Creeks have had periods where the DO levels dropped below the standard over the last two years. Brownstown Creek in particular regularly has levels below the life-support threshold. All of these creeks may need some restoration to reduce internal oxygen demand or increase aeration if macroinvertebrates and fish are to return.
Temperature
The field monitoring crews regularly measure stream temperature at the monitoring sites. The data is not analyzed for impact on biota, but is measured and presented for context. However, most fish species show signs of stress when temperatures exceed 25°C. Sites in the ADW rarely exceed this temperature, but each has on at least one occasion in its monitoring history. The Frank & Poet and Blakely Creeks are generally the warmest creeks, but all have temperature ranges that are supportive of life.
Storms & Loading
Similar to the TP-TSS relationship, the relationships between TP and discharge are highly variable at the monitoring sites throughout the ADW. Figure 15 illustrates this year-to-year variability. In general, when stream flow increases, phosphorus concentrations also are higher. However, at low flows where most of the samples were collected, there is quite a bit of variability in phosphorus concentrations. It is difficult to draw conclusions at this point since we were unable to collect wet weather samples to give a more complete picture of the conditions impacting each of the streams.
Ultimately, TP concentrations can vary widely due to many environmental variables. TP load is a calculated value based on the phosphorus concentration and water flow at a given point in time, and it is expressed as pounds per day. TP loads were estimated for each sampling event. These instantaneous loads can be seen in Figure 16. Since there is such variability in TP loads, it is best to compute annual or seasonal loads from several years of data, including samples from storm flows. No conclusions should be drawn at this point. Additional years of sampling are needed to accurately estimate mean annual loads for phosphorus, sediment or other constituents. TP concentration and TP-TSS relationship graphs for all tributaries are included in Appendix A.
Macroinvertebrates
Over 30 sites across the ADW have been monitored for benthic macroinvertebrates. Many of the sites have been monitored since 2004, though a number of sites were added over the past few years. Table 2 is a summary of SQI through 2014.
Figure 1 shows the location of these sites along with the macroinvertebrate status as of spring 2014. The map shows the location of the monitoring sites along with their most recent 3-year sample mean of the MiCorps Stream Quality Index (SQI), for spring samples. The color indicates the site’s current 3-year status rating, while those sites with arrows indicate the trend (up indicating improving trend, and down indicating declining trend). Only sites with statistically significant trends* are indicated with arrows.
Across all sites, spring SQI ratings were higher than fall ratings(see Figure 2), so it would be inappropriate to combine fall and spring samples. Similar 3-year sample means for fall SQI ratings are depicted in Figure 2.
The geographic pattern of these results suggests that upstream sites have higher SQI ratings than downstream sites across each of the three watersheds. This pattern could reflect a difference in land use or impervious cover. This pattern should be assessed further in future analysis.
These maps also illustrate the range of ratings across sites in the ADW. Most of the sites (69% in Spring; 81% in Fall) are impacted (with ratings of fair or poor) according to the SQI. It is also important to note that ratings are generally higher on the whole for spring samples, and that results for sites with fewer than 3 samples for each season are considered preliminary. Results from each of the three watersheds varied. On average, sites in the Lower Huron had higher SQI ratings (Spring=35, Fall=33) than Combined Downriver (Spring=24, Fall=27) and Ecorse Creek (Spring=22, Fall=27). The differences between the watersheds correlate with the different land use patterns in the watersheds. The Lower Huron generally has a lower amount of impervious cover, has a greater amount of green infrastructure or natural cover and has a greater amount of natural cover in the riparian zone than the other two watersheds. The Lower Huron is also less urbanized and has a greater amount of protected riparian area.
Total Diversity measures (see Figure 3 and Figure 4) show a similar spread across ADW sites. Most of the sites that had high SQI ratings also have high taxa counts. Mean TD measures were more widely spread for Spring sampling than for Fall sampling, which was also true for SQI ratings. In Spring, the diversity of the best site was just over four times greater than that for the worst site. Lower Huron sites had greater diversity in spring (Spring=14, Fall=15), on average, than Combined Downriver (Spring=11, Fall=14) and Ecorse Creek (Spring=11, Fall=13), though fall diversity was statistically similar across all of the ADW watersheds.
*Statistical significance is determined using analysis of variance from linear regression. A threshold probability (α) of 0.10 was used to determine significance.
Trends in Aquatic Quality and Diversity
The macroinvertebrate data was assessed for trends over time by simple regression of Spring and Fall data for each site, and collectively for sites across each watershed. Overall, the mean SQI rating across all sites sampled for each event has increased over time. However, this positive trend has diminished over the past two years. It should be noted that mean ratings can differ each year based on the specific sites sampled, so each point is not truly independent. Also note the difference between Spring and Fall ratings. Still, these results suggest generally improving or stabilizing conditions overall.
Sites in the Lower Huron River watershed show a strong upward trend in spring monitoring for both SQI and TD (Figure 5). The trend for SQI is statistically significant, but not for the diversity measure. This is an encouraging result that indicates improvement in macroinvertebrate colonization and suggests improvements or stabilization of habitat over time. However, as more sites have been sampled over time, the spread of scores has increased.
The fall trend for both measures across Lower Huron sites is decidedly different (Figure 6). The trend is declining. The trend is not statistically significant for either measure. The spread of data across sites appears to be much greater in the fall versus spring sampling. Also, variability year-to-year is greater, suggesting environmental events (such as heavy rain or other climatic events) on the date of sampling are affecting scores for all sites.
For Ecorse Creek watershed sites, the spring trend is strongly positive, similar to that for Lower Huron sites (Figure 7). The trend is significant for spring SQI, but not TD. Macroinvertebrate taxa may have colonized stream sites in greater numbers, but the rate of colonization may be slowing. However, the total diversity trend is not significant. Also, scores appear to be leveling out or even decreasing in recent years, though the trend is not significant.
The trends for fall SQI and TD scores in Ecorse Creek sites are not significant (Figure 8). The differences in fall measures from year to year could be accounted for in environmental conditions at the time of sampling.
Trends for Combined Downriver watershed sites are similar to the other two watersheds (Figure 9). The trend over time historically has been strongly upward, illustrating stabilization in the number and diversity of benthic biota. The trend for Combined Downriver sites is more highly significant and explains a greater amount of the variance (as measured by R2) than with the other two watersheds. This suggests that the trend is more indicative of reaching a state of true equilibrium or stabilization of aquatic habitat. However, it appears that all 3 watersheds show increases in diversity measures until about 2009 or 2010 and then remain relatively stable through the current year.
Fall trends for Combined Downriver sites are similarly less emphatic (Figure 10), and not statistically significant. Again, Combined Downriver sites appear to have recovered to a point, but now may be reaching a state of equilibrium. Alternatively, population numbers may be varying around an average diversity rating.
Flow data analysis to come!
Results By Tributary
Total Phosphorus
Woods Creek remains the station with the lowest mean TP concentration, with a concentration of 0.044 mg/l in 2019 (median of 0.040 mg/l). The mean concentration was 44% lower than the next lowest long-term site at Smith Creek (mean=0.078 mg/l, median=0.070 mg/l), and 17% lower than the big Huron River site (mean=0.053 mg/l, median=0.040 mg/l). The long-term site with the highest mean TP concentration was Brownstown Creek, at 0.091 mg/l (median of 0.090 mg/l). Overall, the runoff flowing out of streams in the ADW are high in phosphorus and contributing to eutrophic conditions downstream in the Detroit River and western basin of Lake Erie.
Of the nine long-term monitoring sites in the ADW, only Blakely Creek shows a significant trend between 2012 (when sampling began) and 2019. Unfortunately, the trend is increasing. The increase is mainly driven by 3 very high samples (0.56 – 1.42 mg/l) in 2018. It is not known what caused these 3 results that were the 3 highest concentrations on record for Blakely Creek. Sampling results at Blakely in 2019 were much lower and all within normal variation with previous data from the site. Most other sites have no discernable trend, but Woods Creek had concentrations that appear to be declining slightly. All but the Blakely trend are not statistically significant, which is not surprising given the fact that the variance (i.e. spread) of the results is so wide.
HRWC assesses TP concentrations in Wanye County waterways against a standard of 0.07 mg/l, which is the long-term 75th percentile concentration at Woods Creek, which is defined as the “reference site” for the area. That standard is also consistent with regional analysis conducted by the U.S. EPA in 2001. Tributaries are assessed on the most recent five years sampling data and graded on how many samples are below the target threshold according to the following scale:
- A = 80-100%
- B = 60-80%
- C = 40-60%
- D = 20-40%
- F = 0-20%
The table below lists current grades for each tributary stream through data collected through 2020.
Total Phosphorus Grades by Long-Term Site
| Frank and Poet Creek
D (40%) |
Blakely Creek
D (20%) |
Brownstown Creek
D (25%) |
S. Ecorse Creek
D (37%) |
N. Ecorse Creek
D (24%) |
| Woods Creek
A (83%) |
Silver Creek
D (31%) |
Smith Creek
C (46%) |
Huron River (Rockwood)B (79%) |
Total Suspended Solids
Of all long-term sites, the Huron River site at Rockwood had the lowest TSS concentrations at 12.2 mg/l on average. Of the smaller creek sites, Silver Creek was the clearest at 13.8 mg/l on average and no TSS measurement above 28 mg/l. The highest sediment concentrations were found in S. Ecorse Creek, with a mean TSS concentration of 32.3 mg/l. The five sites that exceeded the sediment threshold of 80 mg/l were Frank & Poet, N. Ecorse, S. Ecorse, Woods and Smith Creeks, suggesting erosion may be occurring in these stream channels. Over the period of record, Blakely and S. Ecorse Creeks have the highest threshold exceedance rates at 5.2% of samples over an eight-year period. The Huron River site has never (four years of sampling) exceeded the threshold, indicating stable river banks. Silver, Frank & Poet and Woods Creeks all have exceedance rates below 2.5%.
No trends in TSS concentrations were statistically significant.
HRWC assesses TSS concentrations in Wayne County waterways against a stormwater standard of 80 mg/l. With this standard, the stream should not exceed the threshold during storms (or ever). Since storm samples are rare, grade ranges are narrow. Tributaries are assessed on the most recent five years sampling data and graded on how many samples are below the target threshold according to the following scale:
- A = 99-100%
- B = 96-99%
- C = 92-96%
- D = 85-92%
- F = 0-85%
The table below lists current grades for each tributary stream through data collected through 2020.
Total Suspended Sediment Grades by Long-Term Site
| Frank and Poet Creek
B (96%) |
Blakely Creek
C (93%) |
Brownstown Creek
B (98%) |
S. Ecorse Creek
C (93%) |
N. Ecorse Creek
C (94%) |
| Woods Creek
A (100%) |
Silver Creek
B (98%) |
Smith Creek
B (96%) |
Huron River (Rockwood)A (100%) |
Bacteria
HRWC assesses bacteria concentrations in Middle Huron tributaries against the state’s single sample standard of 300 E. coli units for full contact waters. With this standard, the stream should not exceed the threshold for a single sample out of 5 sample dates. However, a stream may exceed this value in up to 10% of samples if it’s 5-sample mean (geomean, actually) meets a lower standard of 130 units/100 mL sample. Over the entire period of record, the region’s reference site (Woods Creek) met the standard 77% of the time, so it is a difficult standard to meet in the coastal plain ecoregion of Michigan. Grade ranges are based on these state standards, where B grade streams should meet the water quality standard for bacteria. Tributaries are assessed on the most recent five years sampling data and graded on how many samples are below the target threshold according to the following scale:
- A = 97-100%
- B = 90-97%
- C = 75-90%
- D = 50-75%
- F = 0-50%
The table below lists current grades for each tributary stream through data collected through 2020.
Bacteria Grades by Long-Term Site
| Frank and Poet Creek
F (29%) |
Blakely Creek
F (27%) |
Brownstown Creek
F (17%) |
S. Ecorse Creek
F (9%) |
N. Ecorse Creek
F (14%) |
| Woods Creek
D (77%) |
Silver Creek
F (27%) |
Smith Creek
F (45%) |
Huron River (Rockwood)C (89%) |
Conductivity
Analysis to come!
Dissolved Oxygen
Analysis to come!
Temperature
Analysis to come!
Flow
Analysis to come!
Storm & Loading
Analysis to come!
Macroinvertebrates
Analysis to come!
Acknowledgements
Funding Partners & Governments

The Wayne County/Downriver Chemistry and Flow Monitoring Program is a project of the Alliance of Downriver Watersheds. The ADW is a voluntary watershed-based group of 23 public agencies working together since 2007 to cooperatively manage the rivers, lakes and streams within the watershed. Member governments include:
Allen Park
Belleville
Dearborn Heights
Ecorse
Flat Rock
Gibraltar
Grosse Ile Township
Inkster
Lincoln Park
Melvindale
Riverview
Rockwood
Romulus
Southgate
Sumpter Township
Taylor
Van Buren Township
Wayne County
Westland
Woodhaven
Woodhaven-Brownstown School District
Wyandotte
Partners and Volunteers
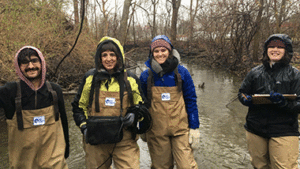
The strength and breadth of the ADW Chemistry and Flow Monitoring Program is made possible by the generous time and effort provided by the over 40 annual volunteers. The ADW and the Huron River Watershed Council would like to sincerely thank the volunteers and leaders for their dedication to the program.
The ADW would also like to thank the Downriver Utility Wastewater Authority in Wyandotte for providing water sample processing and analysis.
Contact Information
For additional information on the Chemistry and Flow Monitoring Program and results, please contact Ric Lawson at [email protected].
To become a volunteer in the program, please visit hrwc.org/chemflow.