


Program Overview
The Middle Huron Chemistry and Flow Monitoring Program was developed in 2002 as a response to community interest in increasing available data on nutrient contributions to the middle section of the Huron River. The Chemistry and Flow Monitoring Program is a volunteer-supported program that has expanded over the years in response to emerging water quality concerns; the program now includes 11 long-term stations and monitors multiple water quality parameters including nutrients (total phosphorus and inorganic nitrogen), sediments (total suspended solids), bacteria, chloride, sulfate, dissolved oxygen, conductivity, pH, and temperature. Collected data support a better understanding of pollution contributions from non-point sources in the Middle Huron and, in turn, help local municipalities focus and track pollution reduction efforts as they strive to meet water quality standards and policies such as Total Maximum Daily Load (TMDL) targets. Important TMDLs in the Middle Huron include those for nutrification (phosphorus) for Ford and Belleville lakes, pathogens such as bacteria (E. coli) in a number of stream/river reaches, and biota (altered flow and sedimentation) in Malletts Creek and Swift Run.
Results Summary
The following general conclusions can be drawn from the analysis of the data collected under the Middle Huron Chemistry and Flow Monitoring Program from 2002 through 2023:
- Total Phosphorus (TP): In isolation, total phosphorus (TP) concentrations show no consistent trends across the Middle Huron watershed. However, after accounting for stream flow, there is a significant annual decrease in TP. Also, since 2013, concentrations during baseflow conditions at several sites show declining trends in TP and most median concentrations are below the previous TMDL target of 0.05 mg/L. In 2023, most sites had the lowest recorded average and median concentrations since the start of the monitoring program, many of which were below or near (± 0.005 mg/L) the new TMDL target of 0.03 mg/L.
- Total Suspended Solids (TSS): Concentrations of TSS across the Middle Huron, though variable, are well below target standards. Occasionally TSS exceeds state standards during storms. Previously, Malletts Creek and Swift Run, had exceeded these state standards during storms, which, along with poor ratings for macroinvertebrate diversity, prompted TSS targets to be outlined in their 2004 TMDLs for biota. Data from the last five years suggests that sedimentation at these sites is improving; neither site has exceeded the 80 mg/L standard within the last five years. Millers Creek, however, has had several exceedances in the last 5 years including in 2023 with the highest values on record recorded in 2021.
- Pathogens/Bacteria (E. coli): The data collected on E. coli bacteria indicate the main stem of the river meets state standards most of the time, while tributaries to the river regularly exceed state standards. Tributaries draining urban areas tend to have the highest bacterial counts as well as the large, agricultural drainage of Mill Creek. Long-term trends in E. coli, however, are steadily declining at most sites. Consistent with this trend, mean and median E. coli counts in 2023 were the lowest on record at most sites.
- Dissolved Oxygen (DO): All eleven long-term sites have DO concentrations that follow typical seasonal trends with average and median DO concentrations within the normal range for Michigan surface waters (> 5 mg/L). Though, summer concentrations within tributaries of the Huron are often below saturation (i.e. generally < 8 mg/L), especially during extended periods of hot and dry conditions, most sites continue to meet state standards. Swift Run (MH09) is the only site with DO less than or equal to the state standard in the last eight years including 2023.
- Conductivity: Six of the nine tributary sites had average and median conductivity values that exceed the target of 800 µS/cm. Most of these sites are in urban areas of Ann Arbor. These high conductivity readings often correspond with high chloride concentrations above the Michigan state aquatic maximum value.
- pH: Throughout the duration of the monitoring program, pH in the Middle Huron watershed tended to fall within the acceptable range for fresh waters.
- Temperature: Temperature measurements within the Middle Huron watershed follow the typical seasonal trends of a warm water river system. No abnormally high or low temperatures were observed in 2023.
For additional information these parameters and data, please see below.
Site Locations
Data are collected from stream and river locations that best reveal possible relationships between land cover and ecological stream health. The locations are selected based on their use by the Michigan Department of Environment, Great Lakes and Energy (EGLE), the HRWC Adopt-A-Stream volunteer stream monitoring program monitoring locations, likelihood of significant sub-watershed phosphorus loading based on past modeling and capturing the range of sub-watershed and upstream conditions. Monitoring occurs annually during the growing season at eleven long-term sites throughout the Middle Huron. Long-term sites help HRWC to determine changing conditions over time.
Since 2010, HRWC has also monitored investigative sites that are usually sampled for a single monitoring season based on emerging water quality concerns or other areas of interest based on HRWC’s long-term dataset. Investigative sites provide additional spatial coverage to gain a better understanding of pollutant sources and chemistry dynamics.
In 2023, the Chemistry and Flow Monitoring Program sampled three Huron River sites and ten tributary or direct drainage sites, which represent a mix of land uses and communities. Two of the thirteen monitoring sites were investigative sites. For more information about the sites, please see the map below. Orange and purple sites indicate investigative sites, with green markers reflecting long-term sites.
Middle Huron Chemistry and Flow Monitoring Sites
Parameters
Total Phosphorus (TP)
Phosphorus is an essential nutrient for all aquatic plants. It is needed for plant growth and many metabolic reactions in plants and animals. In freshwater systems like the Huron River, phosphorus is typically the growth-limiting factor for aquatic plants. That is, phosphorus controls the pace at which algae and aquatic plants grow and small increases in phosphorus can result in excessive algal growth often termed a bloom. Total Phosphorus (TP) is a measure of all forms of phosphorus (including particulate and dissolved, inorganic and organic forms) present in a water sample and is the primary indicator of eutrophication or excess nutrients in the middle Huron River watershed. A reference or natural background level of TP for rivers and streams in the ecoregion where the middle Huron watershed is located is 0.03 mg/L or ppm and is the target concentration established by the Total Maximum Daily Load (TMDL) for Ford and Belleville lakes.
Further, phosphorus is the main parameter of concern in eutrophic lakes and streams for its role in producing harmful algal blooms, especially blue-green algae. Phosphorus enters surface waters from point sources, such as wastewater treatment plants, and nonpoint sources, including fertilizers, soil erosion and animal waste. Excessive concentrations of this element can quickly lead to excessive growth of aquatic plants and algae. Over abundant algae, especially harmful blue-green algae, has several adverse effects within the water column: reduced water clarity; unpleasant aesthetics and odor; oxygen depletion that can harm aquatic life and lead to fish kills; and the presence of toxins.
Total Suspended Solids (TSS)
Total suspended solids include all particles or material mixed in the water that will not pass through a filter. Thus, TSS is often used as a surrogate measure of water clarity or murkiness. Suspended solids may originate from point sources such as sanitary and industrial wastewater, but most tends to originate from nonpoint sources such as soil erosion from construction sites, urban/suburban sites, agriculture and exposed stream or river banks. As levels of TSS increase in aquatic systems, water temperature increases, levels of dissolved oxygen decrease and aquatic habitat can be covered up. Fish and aquatic insect species are very sensitive to these changes which can lead to a loss of diversity in aquatic life.
While the State of Michigan’s water quality standards do not contain numerical standards for TSS, a narrative standard requires that waters not have any of these physical properties: high turbidity, unnatural color, oil films, floating solids, foam, settleable solids, suspended solids, or deposits. Water with a TSS concentration less than 20 mg/L (ppm) is considered clear. Water with levels between 40 and 80 mg/L appear cloudy, and water with concentrations over 150 mg/L usually appear muddy. A target of 80 mg/L is set as a target for stormwater runoff or wet weather stream measures in Michigan’s stormwater regulations. In streams that have shown impairments to aquatic life due to sedimentation, TSS is used as a surrogate measure for Total Maximum Daily Load (TMDL) regulations, since large amounts of sediment can bury potential habitat for aquatic macroinvertebrates. This is the case for Malletts Creek and Swift Run TMDLs. Those evaluations set the following targets for TSS:
- Optimum: TSS < 25 mg/L
- Good to Moderate: 25 mg/L < TSS < 80 mg/L
- Less than moderate: 80mg/L < TSS < 400 mg/L
- Poor: TSS > 400 mg/L
Sediment-Phosphorus Relationship
Phosphorus tends to bind or stick to soil particles. Thus, identifying a relationship between TP concentrations and the corresponding TSS measurements can help determine whether the TP originates from sediments and erosive processes or is dissolved in the water. If TP and TSS concentrations show a strong, positive relationship, sedimentation is a potential source of P. If there is not a correlation, P may exist as dissolved forms (e.g., phosphate) and originate from other sources. Directly measuring different P forms like dissolved and particulate P could also help identify sources.
Bacteria (E. coli)
Escherichia coli (E. coli) counts serve as a general indicator of the presence of bacteria or other pathogens that originate in the digestive tracts of warm-blooded animals. Their presence may indicate the presence of sewage, wastewater, livestock runoff or other waste sources. These bacterial counts are not specific enough to directly indicate health risks. Consistently high levels, however, serve as a warning of potential health risks and warrant further investigation to determine the source of bacterial contamination. The State of Michigan water quality standard for total body contact (i.e. swimming) is a monthly average of 130 counts per 100 mL, while a single sampling event for waters protected for total body contact is less than 300 E. coli counts per 100 mL. Michigan also regulates that all waters protected for partial body contact recreation have less than 1000 E. coli counts per 100 mL during a single sampling event. Several reaches in the middle Huron are on the state’s list of impaired waters due to bacterial contamination, including Honey Creek, and drainages to and including the Huron River between Argo and Geddes Dams, and Fleming Creek.
Dissolved Oxygen (DO)
Dissolved oxygen (DO) is a measure of the amount of gaseous oxygen (O2) mixed in the water, which enters water through the physical process of aeration or through the biological process of aquatic plant photosynthesis. DO levels drop to very low levels in warm, stagnant water, whereas fast-flowing, cooler water generally has high concentrations of DO. Some forms of pollution can also impact DO levels. For example, excess particles or organic matter as well as nutrients such as phosphorus and nitrogen and resultant algal blooms can reduce DO concentrations.
Most aquatic plants and animals require a certain level of DO for survival. Normal DO values in Michigan waters that support aquatic life range between 5 to 15 mg/L. The statewide minimum water quality standard is 5 mg/L. DO levels below this standard impair aquatic life and hypoxic levels (less than 2 mg/L), harm and even kill most aquatic species. However, concentrations change throughout the day and night due to air and water temperature changes, photosynthesis, respiration, and decomposition.
Conductivity
Conductivity is a measure of conductible (charged, inorganic) substances dissolved in the water, and is a general measure of water quality. Conductible substances include dissolved inorganic compounds, such as metals, sulfates, nitrates, phosphates, and salts. Conductivity is affected by temperature: the warmer the water, the higher the conductivity. Natural conductivity in surface waters is affected primarily by the geology of the area through which the water flows.
In Michigan, values for a healthy river or stream habitat range between 100 and 800 µS/cm. Low values are characteristic of oligotrophic (low nutrient) lake waters, while values above 800 µS/cm are characteristic of eutrophic (high nutrient) lake waters where plants are in abundance. There are also several potential sources of minerals and some natural variations that contribute to conductivity, but consistent results above 800 µS/cm would be unexpected from natural sources. Anthropogenic sources can include winter road salts, fertilizers, and drinking water softeners.
pH
pH provides information about the hydrogen (H+) and hydroxide (OH–) ion concentration in the water or the level of acidity or basicity. pH is measured on a logarithmic scale that ranges from 0 to 14, with 7 being neutral. Solutions with a pH less than 7 are considered acidic and solutions above 7 are considered basic. Organisms that live in rivers and streams can survive only in a limited range of pH values. Michigan Water Quality Standards require pH values to be within the range of 6.5 to 9 for all waters of the state. In Michigan surface waters, most pH values range between 7.6 and 8.0. The pH of rivers and streams may fluctuate due to natural events, but inputs due to human activities can also cause abnormal fluctuations in pH.
Temperature
Water temperature dictates what aquatic life will inhabit waterways and controls the gas content of water such as dissolved oxygen or carbon dioxide (as the temperature of water increases, the concentration of dissolved gases decreases). It also influences the rate of both chemical and biological reactions. Some species require a narrow temperature range to survive and flourish, while others are tolerant of a much broader range.
Nitrogen (Nitrate and Nitrite)
Nitrate (NO3–) and nitrite (NO2–) are both naturally occurring, inorganic forms of nitrogen that support the growth of aquatic plants. Nitrate (NO3–) is the most common form of dissolved nitrogen in surface waters and can originate from precipitation and runoff or the biological conversion of nitrogen gas by algae known as nitrogen fixation. Nitrate is not considered a problem at low levels and typically is not considered the limiting nutrient in freshwater systems like the Huron River. Both phosphorus and nitrogen, however, control the overall productivity of a waterbody (i.e. the amount of plant life at any given time). At high concentrations (at or above 1-2 mg/L), nitrate can contribute to eutrophication that causes algal blooms and low dissolved oxygen levels that are detrimental to aquatic life. High levels of nitrate in surface waters often are related to human activities such as overfertilization of lawns and crops, failing septic and sewage systems, and pet or livestock waste inputs. A typical value of nitrate for Michigan rivers is 0.5 mg/L, although lower nitrate concentrations ranging from 0.01 to 0.1 mg/L are observed in oligotrophic or low nutrient waters.
Nitrite (NO2–) occurs as a transition compound in the conversion of ammonia (NH4+) to nitrate in a process termed nitrification. Unlike nitrate, nitrites are short lived in aquatic systems, so concentrations are often low or near zero. Normal levels of nitrite concentration range from 0.01 to 0.03 mg/L, while levels higher than 0.03 mg/L should be uncommon since this level is at the threshold for chemical transition from ammonia to nitrate. Prolonged exposure to high levels of nitrite can also cause a serious condition in fish called “brown blood disease”, as it blocks the blood’s ability to carry oxygen resulting in fish kills.
Water Velocity/Flow
Measuring water velocity at the long-term monitoring sites, along with collecting water samples that are analyzed for nutrient concentrations, allows for calculating the “load” of a particular nutrient for a specific moment in time. A “load” is a measure of the amount of a substance entering a water body, usually expressed as pounds per year. Concentration, when coupled with stream discharge, can be used to estimate the export rates of various compounds in the water including phosphorus or other nutrients for the sub-watershed, and to estimate the loading rates of these compounds to receiving waters.
Methodology
The procedures used in this monitoring program have been reviewed and approved by the Michigan Department of Environment, Great Lakes, and Energy (EGLE). Complete procedures are documented thoroughly in the program’s Quality Assurance Project Plan (QAPP). The QAPP was originally developed at the beginning of the program in 2003 and revised and approved by EGLE in 2008 and again revised and approved in 2010. The following is a summary of those methods and procedures.
Stream monitoring is conducted twice monthly from April through September at the designated monitoring sites described above. The volunteer monitoring teams visit each site and complete an ArcGIS Survey123 electronic field datasheet documenting the site location, date and time, team members and current and previous day weather conditions. Volunteers also use the Survey123 app to record water sample information and the water quality measurement results from the YSI multimeter for water temperature, pH, DO, and conductivity. If volunteers measured stream flow during a field outing, a Survey123 flow record is created to log 10 – 20 velocity measurements across the width of the stream or river. Upon completion of the fieldwork, the monitoring team delivers water samples to the Ann Arbor Water Treatment Plant Laboratory for analysis of TP, inorganic nitrogen, TSS, E. coli, chloride, and sulfate.
Sample Collection Methodology
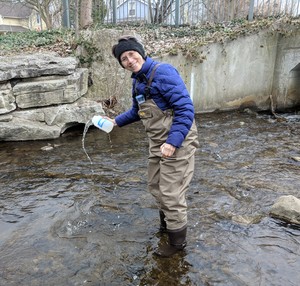
Water samples are completed first at each site to minimize the disturbance of the stream substrate, which could artificially raise the amount of suspended matter in the water column. For all samples, the team member follows the same “grab” sampling protocol in accordance with the method prescribed in the 1994 EGLE field procedures manual for wadable streams.
In brief, one liter in-stream samples are collected in HDPE plastic bottles and capture upstream water from an arm’s length of the volunteer. When stream depth permits, water is taken from the middle of the water column and in the middle of the stream cross-section. Exceptions to this method occur at the Hudson Mills Huron River site (MH01) where samples are collected fifteen feet from the water’s edge. The sample bottles are rinsed three times with stream water prior to taking the sample. A separate 100 mL sample is collected without rinses in a sterile 125 mL sample cup for E. coli analysis. All samples receive labels and are stored on ice in a cooler until delivery to the laboratory for analysis. The laboratory analyzes the samples for TP, TSS, nitrate, nitrite, E. coli, chloride, and sulfate. E. coli analyses are conducted within 6 hours of collection. If TP samples cannot be analyzed within the method-specified holding period after delivery to the lab, they were treated with preservative.

In-Stream Chemistry Monitoring Methodology
Five water quality chemistry parameters – water temperature, DO, conductivity, total dissolved solids (TDS), and pH – are routinely measured at all sites using a YSI Professional Plus (Pro Plus) multiparameter sensor. For all measurements, the multi-probe instrument was submerged at the appropriate water level at arm’s length distance and upstream from the team member. The results were read from the digital display and recorded in the field survey.
Flow Monitoring Methodology
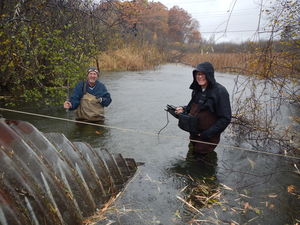
Water velocity is measured directly in the stream after water samples are collected and water quality testing is complete. Flow is measured at each long-term site by team members across a range of measured water levels. Where stream discharge instrumentation or a water level gage are in place, discharge measurements can be charted against water level to establish a “rating curve.” Once established, the rating curves are used to estimate discharge from water level observations. US Geological Survey water-level sensors are located at the Malletts Creek and Mill Creek sites, and a similar sensor maintained by the City of Ann Arbor was placed at Allen Creek in 2007. Since 2015, HRWC has also partnered with the University of Michigan Digital Water Lab to install and maintain low-cost water level sensors that record real time water level data at many of the long-term monitoring sites.
Results by Subwatershed
In this section, water quality parameter trends are assessed at the two long-term sites, MH01 and MH11, located along the main stem of the Huron River.
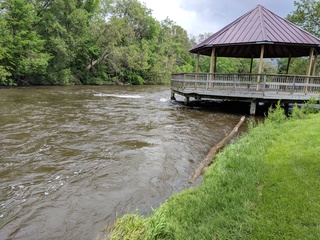
- Huron River at North Territorial Rd. (MH01) – The site is the most upstream sampling location within the Middle Huron subwatershed located in the Hudson Mills Metropark. MH01 is a shallow, wide section of the river located within the designated Natural River District, south of the chain of lakes and serves as a reference site for the Middle Huron subwatershed.
- Huron River at East Cross St. (MH11) – The site is the most downstream sampling location within the Middle Huron subwatershed located in Riverside Park in Ypsilanti, Michigan. MH11 is a wide, deep section of the river. It is located downstream of several municipal wastewater treatment plants that contribute point sources of pollution to the river and downstream of all the monitored tributaries in the subwatershed that contribute additional point source pollution and nonpoint source runoff from a variety of land uses including agricultural land, urban and suburban areas, and commercial/industrial areas. Further, MH11 is situated just upstream of both Ford and Belleville lakes that have experienced persistent harmful algal blooms since the 1970s. Thus, MH11 serves as an indicator of the water quality entering these two impaired lakes.
The data collected from these two sites, MH01 and MH11, help to characterize upstream and downstream spatial patterns, track improvements to water quality over time, and diagnose emerging water quality concerns in the main stem of the Huron River. Data collected in the tributaries to the river is explored in the following section, Results by Tributary.
Total Phosphorus (TP)

Averaged annual TP concentrations in the main stem of the Huron River increase from upstream to downstream and tend to decrease over the course of the monitoring program history (2003 to 2023; Figure 1). Figure 1 (top) shows TP concentrations over time in the Huron River at North Territorial in Hudson Mills Metropark (MH01), and Figure 1 (bottom) shows TP concentrations over time in the Huron River at East Cross St. in Riverside Park (MH11). MH01 is situated within a designated Natural River District, south of the Chain of Lakes, a section of the river that removes TP through lake settling processes. TP concentrations at MH01 are much lower than at MH11, with the mean and median values for eight of the nine previous years falling below the 0.03 mg/L TMDL target for Ford and Belleville lakes (Figure 1, top). As water flows downstream to MH11, the final sampling point before Ford and Belleville Lakes, multiple tributaries (i.e. all 9 other long-term monitoring sites) contribute additional nutrients from watersheds draining a variety of land uses, mainly urban and suburban areas of Ann Arbor. Point sources such as wastewater treatment plants in Dexter and Ann Arbor also input TP into the river before the MH11 sampling location. These inputs are reflected by the generally higher TP concentrations recorded at MH11 (Figure 1, bottom). Overall, the median and average concentrations at MH11 have trended downward since 2014 when the site was first added to the monitoring program (linear regression of means: slope = -1.8 ug/L, R-squared = 0.5, p-value < 0.05), but average and median values have been above the 0.03 mg/L target, at around 0.05 mg/L for the last five years.
These observed trends in the Huron River over space and time suggest that efforts to reduce TP in stormwater runoff are working, but stormwater runoff is still a major pathway of overall phosphorus loading to the middle Huron River. These decreases in TP are clearer and confirmed when evaluating changes in TP loads rather than concentration (reported elsewhere).
2023 TP at Investigative Huron River Site: Huron River at Superior Road (HR13) – In 2023, another Huron River site located upstream of MH11 at Superior Road (HR13) was monitored to understand nutrients and sediment concentrations upstream of the Peninsular Paper Dam, which is scheduled for removal. Like MH11, HR13 is downstream of all the monitored tributary sites and notable point sources of TP. Here TP concentrations ranged from 0.023 mg/L to 0.1 mg/L with an average and median values of 0.047 mg/L and 0.037 mg/L, respectively. These mid-values are still above the desired TMDL target but are 15% and 28% lower than the average and median values observed at MH11 in 2023. This suggests that phosphorus sources below the dam are increasing the TP concentration in the Huron River.
While located on either side of the Peninsular Paper Dam, HR13 and MH11 showed similar patterns in TP concentrations throughout the monitoring season with high concentrations recorded between late May and mid-July (maximum spikes recorded on July 3rd) during a period of abnormally hot and dry atmospheric conditions. The TP concentrations at these two sites deviate from one another after the two major storm events that occurred on July 26th and August 24th. After these storm events, the TP concentration at HR13 decreased while remaining high at MH11. The reason for the differing trends is unclear but may be due to dilution or increased inputs of TP from dam releases or spill overs during these events or increased TP inputs from areas in the Ypsilanti region of the sub-watershed.
TSS
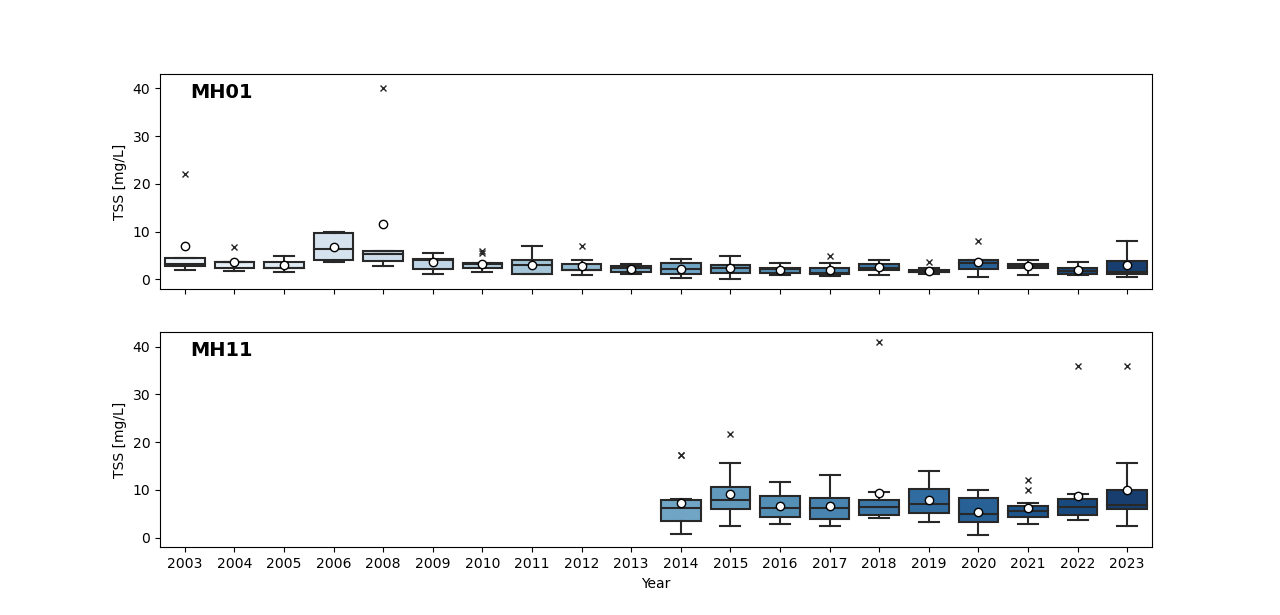
TSS concentrations in the main stem of the Huron River have remained below the target threshold of 80 mg/L over the course of the monitoring history (Figure 2). TSS concentrations at MH01 generally range between 1.5 and 3.6 mg/L. Despite the inputs of TSS from tributaries, including those listed as impaired for sedimentation, TSS concentrations only increase slightly downstream at MH11 with a range between 4.75 mg/L and 9.1 mg/L. No values at MH11 have ever exceeded the 80 mg/L target. In fact, the maximum value ever recorded at MH11 was 41 mg/L in 2018. Similar maximum values were observed in 2022 and 2023, respectively. These ranges suggest that sedimentation in the river is not a habitat impairment at either end of the watershed, though it could be impaired in unobserved river reaches.
2023 TSS at Investigative Huron River Site: Huron River at Superior Road (HR13) – Like both MH01 and MH11, TSS concentrations were low at this investigative site in 2023, ranging from 2.8 mg/L to 8.4 mg/L. This suggests suspended solids are not more abundant upstream of the Peninsular Paper Dam. This does not mean that sediment hasn’t built up on the riverbed behind the dam over time, but rather that there simply aren’t many particles mixed within the water column.
Sediment-phosphorus relationship
Neither MH01 nor MH11 show strong sediment-phosphorus relationships with r-squared values < 0.1 which suggests most of the phosphorus in the main stem of the Huron exists as dissolved forms. Phosphorus may enter the river primarily as dissolved phosphorus or transformational processes such as microbial decomposition within the river may convert particulate phosphorus to dissolved forms. The relationship between sediment and phosphorus increases from upstream (MH01 r-squared <0.001) to downstream (MH11 r-squared = 0.071). This suggests that more particulate P is picked up along the way and could explain ~7% of the variation in phosphorus at MH11, but additional analysis of particulate P and dissolved P is needed for confirmation.
Bacteria (E. coli)

E. coli bacteria levels in the main stem of the Huron River regularly meet state standards for recreational partial and full body contact (Figure 3). E. coli values are highly variable in the river, but geomeans and medians for both the most upstream and downstream Huron River sites are less than the 300 counts/100 mL single event, full body contact standard for all monitored years (Figure 3). Bacterial counts at the most upstream river site, MH01, are very low (Figure 3, top), reflective of primarily natural inputs and lake exposure upstream. For example, in 2023, the geomean and median values at the site were 14 counts/100mL and 19 counts/100mL, respectively. Bacterial counts at this site have only ever exceeded the full body contact standard three times in the 22-year monitoring record, none of which have occurred within the last six years (Figure 3, top). The downriver site, MH11, has had slightly higher E. coli counts over the years (Figure 3, bottom). The 2023 geomean and median values at the site were 88 counts/100mL and 122 counts/100mL, respectively, which are below the low monthly standard of 130 counts/100mL. Most E. coli values at MH11 stay below the single-sample recreational standards. Counts only exceeded the partial body contact standard (1000 counts/100mL) two times, once in 2017 and in 2019, and the full body contact standard has only been violated twice in the last four years in 2020 and 2022. These high E. coli values were observed during single sampling events and generally after storms.
Overall, there has been a general decrease in the magnitude and number of bacterial measurements above the full body contact standard at MH11 (Figure 3, bottom). This may be reflective of the observed decreases in E. coli counts at some tributary sites (see tributary results). These low E. coli counts are encouraging, especially with the new statewide E. coli TMDL, and tend to support the health and safety of water recreators over the vast majority of river conditions.
Nitrogen
Nitrate
An examination of nitrate levels shows that median concentrations for monitoring sites measured from 2003-2019 ranged from 0.20 mg/L at MH01 to 1.1 mg/L at MH11. The median concentration at MH11 suggests that the water entering Ford and Belleville lakes is considered eutrophic with respect to nitrogen more than 50% of the time. There are some higher concentrations of nitrate (medians ≥ 0.5 mg/L) in monitored tributaries, namely those draining agricultural land (e.g. Boyden, Mill, and Honey creeks), that contribute to these high downstream concentrations, but all mean and median values are below 1 mg/L. This is concerning since concentrations seem to be holding steady with no improvement over time. Further investigation of nitrate loads is needed to better understand overall nitrate trends and sources because these nitrate levels could be contributing to the likelihood and toxicity of algae blooms in Ford and Belleville lakes.
2023 Nitrate at Investigative Huron River Site: Huron River at Superior Road (HR13) – Like MH11, nitrate concentrations are elevated at HR13. HR13 values are slightly higher (within a few micrograms; 7% higher median) than MH11 values, which may be due to removal processes behind the dam and few inputs downstream of the dam. In 2023, concentrations at HR13 ranged from 0.7 mg/L to 1.7 mg/L with a median value of 1.3 mg/L. The median and average were within a few micrograms of 2023 MH11 values. Again, this suggests the main stem of the river downstream of Ann Arbor experiences eutrophic conditions more than 50% of the time.
Nitrite
Most nitrite concentrations in the main stem of the Huron are below laboratory detection levels or below the lower limit of normal nitrate concentrations (0.01mg/L). Like TP and nitrate, median nitrite concentrations are slightly lower upstream than downstream. Even still, 75% of all nitrite values at MH11 are below 0.012 mg/L.
Conductivity
Due to both natural weathering processes as well as increased inputs, conductivity increases along the middle Huron River from upstream to downstream. Median conductivity over time at MH01 is 683 µS/cm and at MH11 is 791 µS/cm. Both values fall within the natural conductivity range for the geological region of the watershed, but the MH11 median is near the upper limit for healthy waters (800 µS/cm). In fact, about half of all MH11 conductivity measurements fall above this healthy waters limit, while less than 25% of all MH01 conductivity measurements exceed the limit. There are several tributaries that drain urban and suburban areas between MH01 and MH11 that have extremely high conductivity (i.e. medians > 1000 µS/cm at Allen, Millers, Malletts, and Swift Run Creeks). Together these high concentrations suggest there are likely unnatural inputs of conductivity to the middle Huron River that require further investigation and may impact aquatic life, especially macroinvertebrates.
Chloride and sulfate analyses were added in 2014 to help to evaluate potential salt inputs contributing to high conductivity that may enter the river through contaminated ground water or runoff from applications of road salts in the winter. Sulfate concentrations at both MH01 and MH11 are much lower than state standards (i.e. 10 to 30 times lower) and thus, do not suggest large sulfate contributions. Chloride values, however, have median values (100 mg/L and 110mg/L, respectively) that are near the state’s long-term chronic exposure threshold of 150 mg/L, but there has never been long-term exposure above this limit (only two records total). Thus, salt inputs are not yet a chronic issue in the main stem of the river but may become more of a problem as salt continues to build up over time. Chloride concentrations are also similar up and downstream suggesting salt inputs are ubiquitous across the watershed.
Dissolved Oxygen
Reliable DO records have been available since 2014. During this shorter record, DO measurements in the main stem of the Huron River typically meet state standards. DO concentrations are often near the respective water temperature 100% saturation values following typical seasonal trends with high concentrations in the spring when water temperatures are low that then decrease during the summer when water temperatures rise. There have only been 4 instances of DO falling below the 5 mg/L threshold for aquatic life in the main stem of the river, none of which have occurred in the last eight years.
pH
The Middle Huron has stable pH values between the acceptable range of 6.5 to 9. Most pH values in the Middle Huron River and tributaries fall between 7.5 and 8.3. pH is more stable in the main stem of the river with both the average and median values remaining constant around 8.2 at the most upstream (MH01) and downstream (MH11) monitoring sites over the course of the monitoring history. Only two pH records at MH01 fell below state standards to values of 6.1 and 6 in 2013. No other occurrences of more acidic or basic conditions have been recorded in the main stem of the river since.
Temperature
The monitoring season occurs during the spring and summer months when water temperatures increase. Temperatures in the Huron River start cold in early April (i.e. between 5 – 10°C) and warm into the summer months (generally between 20 – 30°C). In the summer months, native fish species will seek cooler water or die off when water temperatures exceed 29°C (85°F). There have only been 6 water temperature records throughout the 22-year monitoring history that have exceeded this threshold. Most of those exceedances (i.e. 5 samples) occurred at the most upstream Huron River monitoring station at North Territorial Road. All these exceedances were short lived and occurred in the month of July in 2011, 2012, 2013, and 2016 during periods of above average atmospheric temperatures. This Huron River site is shallower than MH11, making it more sensitive to atmospheric temperature changes and sun exposure. Since there are deeper water sections upstream and downstream of MH11, these high temperature periods are likely not having a major impact on aquatic species.
Flow
Visit the Digital Water Lab Water Level and Flow webpage to explore flow records.
Explore Our Chemistry DataResults by Tributary
In this section, water quality parameter trends are assessed at each of the nine long-term tributary sites: Mill, Boyden, Honey, Allen, Traver, Millers, Malletts, Fleming, and Swift Run creeks. Water quality trends are examined across sites to look for trends related to land cover and use and drainage size as well as to identify potential hot spots of pollutants. Mill, Boyden, and Fleming sub-watersheds have small amounts of impervious surfaces and drain greater than 25% agricultural land. Honey and Traver creeksheds also drain agricultural land (> 25%), as well as an approximately equal portion of urban and suburban residential and commercial land (> 20%). Allen, Millers, Malletts, and Swift Run creeks drain primarily urban and suburban areas (> 50%) consisting of residential and commercial areas with high percentages of impervious surfaces. Mill Creek is the largest of the sub-watersheds and Millers is the smallest.
Overall, the sites with urban drainages tend to have more water quality concerns than those draining agricultural land. Urbanized sites tend to be hot spots for nutrients, sediments, E. coli, and conductivity pollution based on evaluations of concentrations. Nutrient concentrations and additional analysis of pollutant loads show that agricultural sites, especially Mill Creek, are large contributors of phosphorus and nitrogen and more recently sediments to the Middle Huron.
Total Phosphorus (TP)
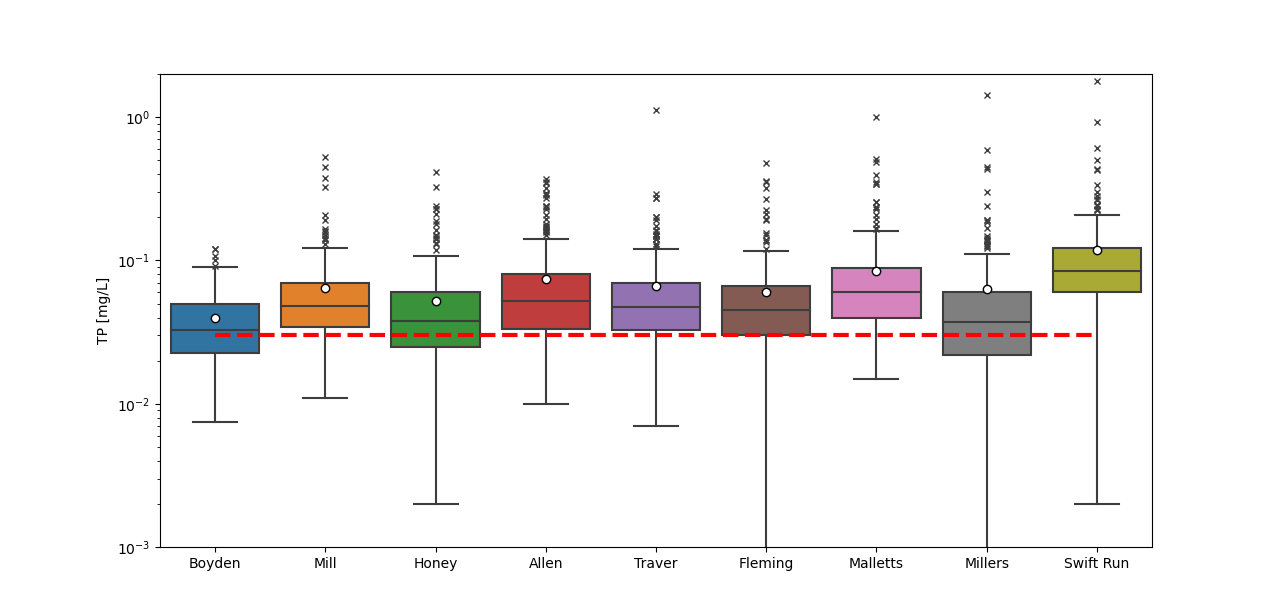
HRWC assesses TP concentrations in Middle Huron tributaries against a standard of 0.034 mg P/L, which is the long-term 75th percentile concentration at the Huron River at North Territorial site, MH01, which is defined as the “reference site” for this part of the watershed. That standard is also consistent with regional analysis conducted by the U.S. EPA in 2001. Tributaries are assigned a TP grade based on the percentage of data collected over the last five years that fell below the target threshold according to the following scale:
- A = 80-100%
- B = 60-80%
- C = 40-60%
- D = 20-40%
- F = 0-20%
The table below lists current grades for each tributary from data collected between 2019 and 2023.
Total Phosphorus Charts by Long-Term Site
| Huron River (N. Territorial)
A (85%) |
Mill Creek
D (24%) |
Boyden Creek
C (54%) |
Honey Creek
C (50%) |
Allens Creek
C (40%) |
| Traver Creek
D (36%) |
Millers Creek
C (48%) |
Malletts Creek
F (17%) |
Swift Run
F (0%) |
Fleming Creek
D (25%) |
| Huron River (Michigan Ave)
F (12%) |
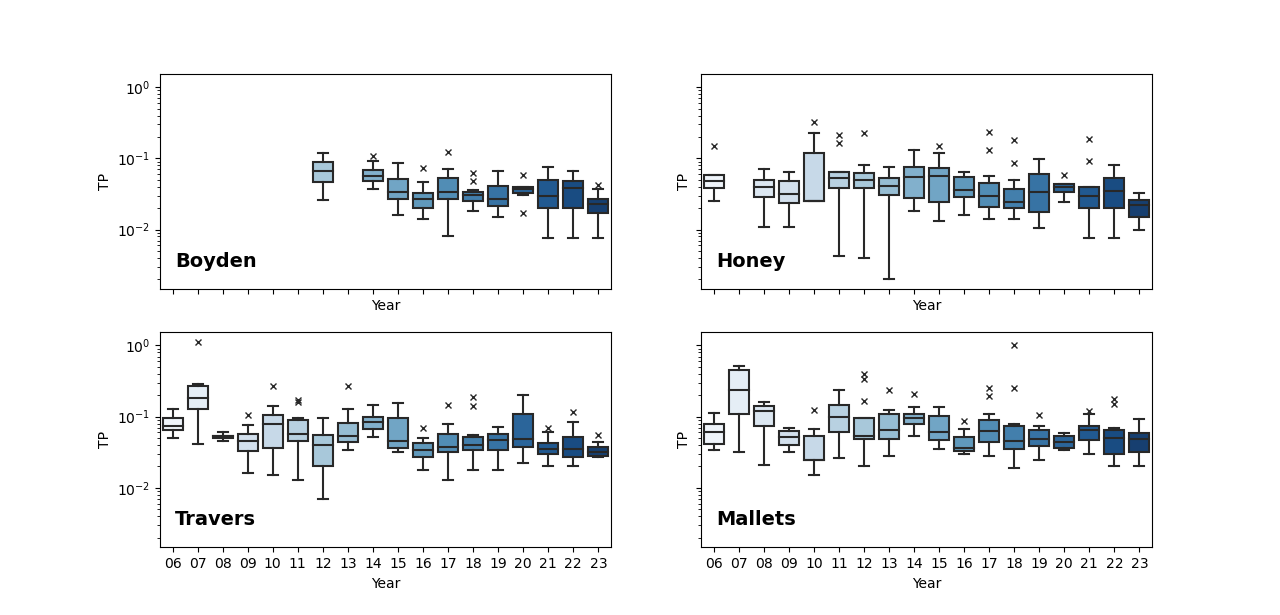
Individual river and tributary site data help decipher potential sources of phosphorus in the Middle Huron subwatershed. Individual tributary results are not representative of conditions throughout the Middle Huron watershed, but rather represent the conditions within the respective tributary and sub-watershed. Figure 4 shows TP concentrations for each long-term middle Huron tributary site over the entire period of record (2002-2023).
TP concentrations are variable within a single site and among sites, but all have average and median values above the 0.03 mg/L target. That said, most sites show an overall decreasing trend in TP concentrations over time with many of the lowest mean and median values recorded in 2023 (Figure 5; especially Boyden, Honey, Traver, and Malletts creeks). This decreasing trend in TP has been confirmed by load estimate analyses.
One of the smallest creeksheds with the least amounts of impervious surfaces, Boyden Creek, has the lowest recorded TP concentrations across all sites with the lowest average and median values recorded in 2023 of 0.022 mg/L and 0.023mg/L, respectively. The Boyden Creek site is below an impoundment, which likely acts as a phosphorus sink. Mill Creek, the other largely agricultural drainage, had some of the lowest recorded TP mean and median values in 2023 with the lowest maximum value ever recorded at the site (0.054 mg/L). These lower TP concentrations at Mill Creek in 2023 are especially notable because this creekshed was named as one of the largest nonpoint source inputs of TP to Ford and Belleville Lake in the TMDL. This is, however, only a decrease seen in one year of data.
TP concentrations at sites draining urban areas are generally higher than concentrations at sites draining agricultural or more mixed land use areas. For example, Swift Run, a small creekshed that drains primarily commercial and residential areas, has the highest recorded TP concentrations overall. In 2023, TP concentrations at Swift Run were lower than most other years, but the average (0.071 mg/L) and median (0.066 mg/L) were still more than twice the 0.03 mg/L TMDL target. Other urban sites also had some of the lowest recorded TP mid-value concentrations in 2023, but most still tended to be higher than sites draining less impervious land. One exception is Allen Creek, which has seen a general decrease in TP since 2014 apart from the year 2020 (this year has half the number of data points compared to other years that may skew the mean and median for this year). The lowest recorded median at this site was reported in 2023 with a value of 0.028 mg/L.
TSS
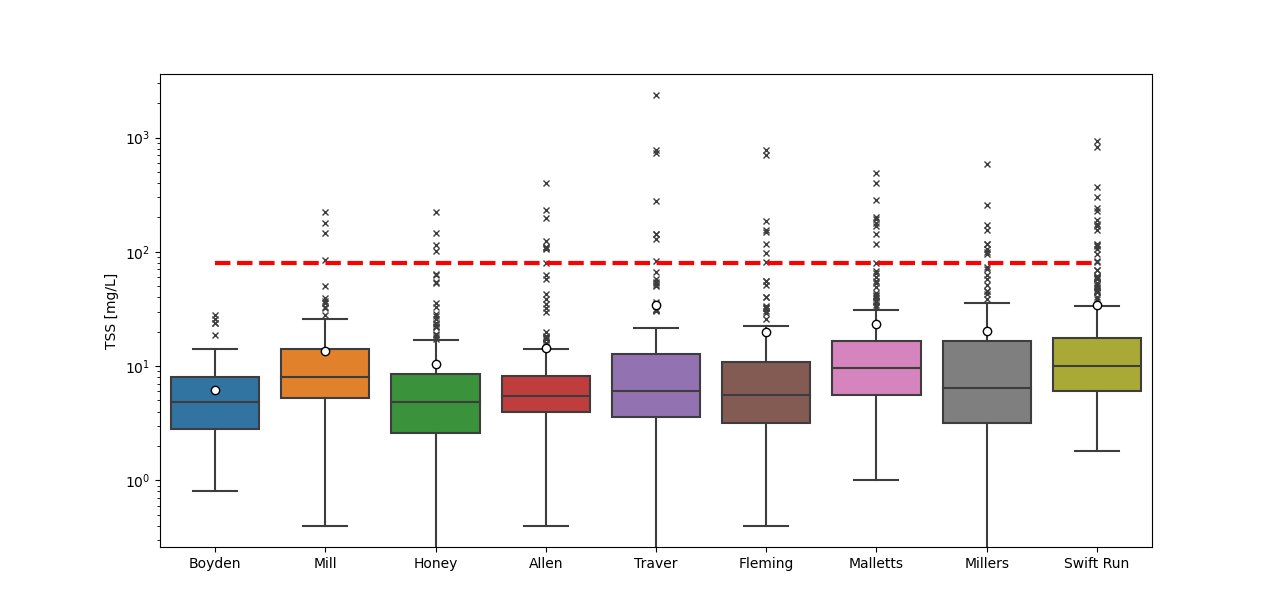
HRWC assesses TSS concentrations in Middle Huron tributaries against a stormwater standard of 80 mg/L. With this standard, the stream should not exceed the threshold during high precipitation events (or ever). Since storm samples are rare, grade ranges are narrow. Tributaries are assigned a TSS grade based on the percentage of data collected over the last five years that fell below the target threshold according to the following scale:
- A = 99-100%
- B = 96-99%
- C = 92-96%
- D = 85-92%
- F = 0-85%
The table below lists current grades for each tributary from data collected between 2019 and 2023.
Total Suspended Sediment Grades by Long-Term Site
| Huron River (N. Territorial)
A (100%) |
Mill Creek
B (98%) |
Boyden Creek
A (100%) |
Honey Creek
A (100%) |
Allens Creek
B (96%) |
| Traver Creek
B (96%) |
Millers Creek
C (94%) |
Malletts Creek
A (100%) |
Swift Run
A (100%) |
Fleming Creek
B (98%) |
| Huron River (Michigan Ave)
A (100%) |
Most TSS concentrations are below the state standard, but storms can generate turbid runoff with values above this threshold (Figure 6; outliers above red line marked with “x”). Over the past five years, storm erosion has been minimal with all sites receiving scores of a “C” or above. Four creeks – Boyden, Honey, Malletts, and Swift Run creeks – have had no samples above 80 mg/L in the last 5 years. These results suggest that the stream bank erosion conditions in Malletts and Swift Run are improving and meeting the TSS targets outlined in their respective 2004 TMDLs to protect biota. Even still, additional targeted storm sampling, which has been on hold since the start of the COVID-19 pandemic, should be conducted to confirm this conclusion. The other five sites had at least one spike in TSS in the last five years with the highest spikes recorded in 2020 at Millers Creek (590 mg/L) and in 2021 at Mill Creek (222 mg/L).
Sediment-phosphorus relationship
Unlike the main stem of the Huron River, several of the tributaries show sediment-phosphorus relationships. Malletts, Swift Run, and Mill creeks show the strongest relationships. Over 70% of the phosphorus concentrations in Malletts Creek can be explained by variation in TSS. That suggests TP in Malletts Creek is mostly due to erosive processes. While around 50% of the phosphorus in Swift and Mill creek is explained by suspended particles. The improvements to TSS values at Malletts and Swift Run creeks suggest that erosion reduction may have led to reductions in TP in those creeks. Mill Creek has had one spike in TSS (222 mg/L) in the last five years that corresponded with high TP (0.53 mg/L), but TSS and TP concentrations don’t show signs of increasing trends. Other sites have sediment-phosphorus relationships with r-squared values between 0.09 and 0.4 suggesting that more than 50% of the TP at these sites is likely comprised of dissolved phosphorus. All these relationships are not as well resolved at low concentrations, but these relationships begin to characterize TP and identify potential sources of TP to individual creeksheds.
Bacteria (E. coli)
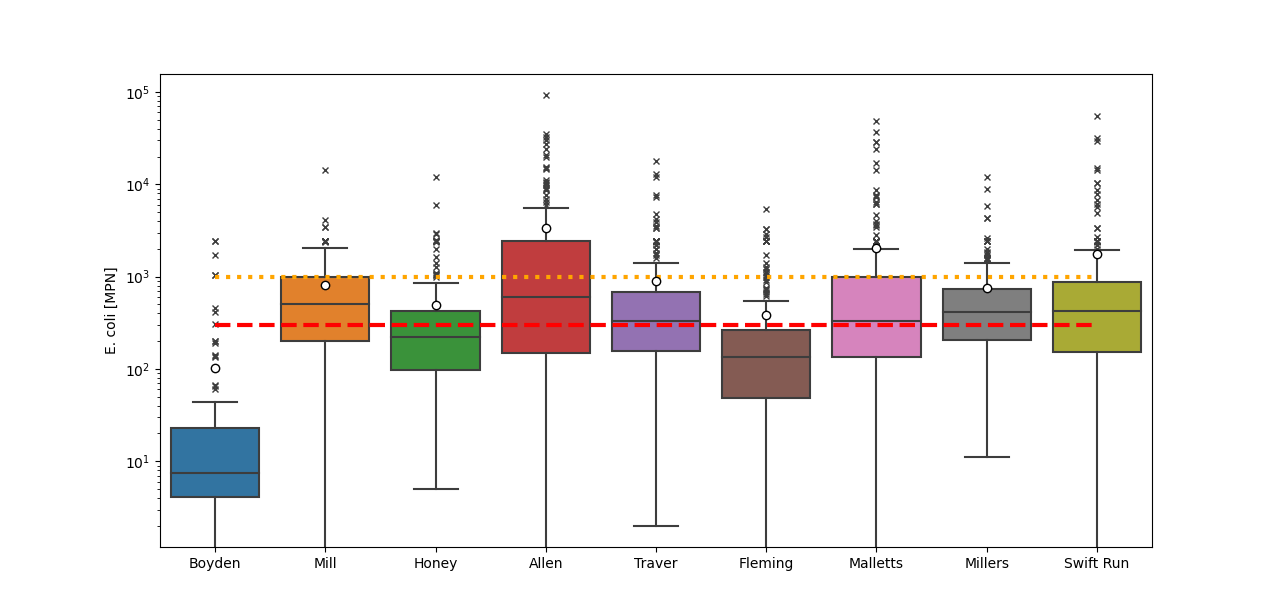
HRWC assesses bacteria levels in Middle Huron tributaries against the state’s single sample standard of 300 E. coli counts per 100 mL for full body contact. Tributaries are assigned a bacterial grade based on the percentage of data collected over the last five years that fell below the 300 E. coli counts per 100 mL target threshold according to the following scale:
- A = 97-100%
- B = 90-97%
- C = 75-90%
- D = 50-75%
- F = 0-50%
The table below lists current grades for each tributary from data collected between 2019 and 2023.
Bacteria Grades by Long-Term Site
| Huron River (N. Territorial)
A (100%) |
Mill Creek
F (21%) |
Boyden Creek
B (94%) |
Honey Creek
D (55%) |
Allens Creek
D (52%) |
| Traver Creek
F (49%) |
Millers Creek
F (44%) |
Malletts Creek
F (48%) |
Swift Run
F (44%) |
Fleming Creek
C (79%) |
| Huron River (Michigan Ave)
B (92%) |
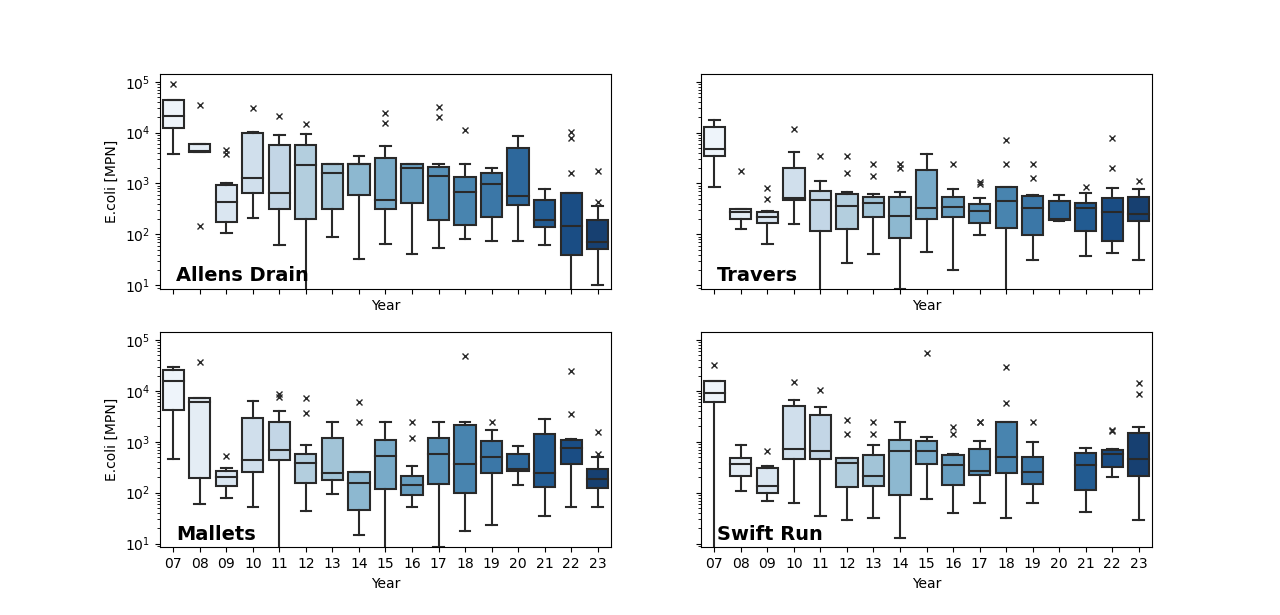
Bacterial data has been collected since 2007 at most sites (Figure 7). E. coli counts are highly variable over short spatial (meters) and temporal (hours) scales; thus, individual data points only show a brief snapshot of conditions and geometric means and medians are used to best assess trends in the data. The first year of E. coli data, 2007, was collected specifically during storm events which unsurprisingly yielded the highest recorded values with particularly high counts at some of the urban and mixed land use sites including Allen, Malletts, Swift Run, and Traver creeks (Figure 8). These high E. coli counts during storm events corresponded with some of the highest recorded TSS. Ever since, E. coli counts have been monitored during ambient conditions and have shown some decreasing trends over time at sites such as Malletts, Swift Run, and Traver creeks with a significant decreasing trend documented at Allen creek (Figure 8). Despite signs of improvement, these sites still have E. coli counts that often exceed the standards for full-body contact, which earned them a bacterial score of an “F.”
Other sites also show signs of improvement, with generally lower maximums over the last 5 years and decreasing geomeans and medians. In 2023, some of the lowest E. coli geomeans and medians were recorded at Boyden, Honey, and Fleming creeks. One exception is Mill Creek, a highly agricultural drainage, which has had three of its four highest geomeans and medians in the last three years, earning it an “F” score. Further investigation of potential sources, in addition to past bacterial source tracking, is necessary at this site to address these increases.
Overall, more work is needed to address E. coli in the tributaries of the Middle Huron Watershed and the public should be advised of the risks of recreating in these creeks. Full body contact activities are ill-advised, and recreationalists should use caution and disinfect after contact with tributaries, especially after storms, due to many streams exceeding the partial body contact standard (~25% or more of the time) in the last five years.
Nitrogen
Nitrogen concentrations are generally low at all Middle Huron tributary sites; nitrate concentrations are not indicative of eutrophic conditions in the tributaries themselves and nitrite values are generally near detection limits. Allen, Mill, Boyden, Millers, and Honey creeks have had at least one median concentration ≥ 0.5 mg/L in the last five years. Allen Creek has seen declining nitrate concentrations over time; median concentrations halved since the start of the monitoring program. Nitrate concentrations at Mill Creek, however, have not changed much over time. Two of Mill Creek’s lowest median concentrations were 0.61 mg/L and 0.6 mg/L in 2020 and 2023 and the highest median concentration was 0.85 mg/L in 2021. It is unsurprising that this agricultural creekshed has high nutrients, likely from fertilizer applications, and as the largest creekshed in the Middle Huron, it is likely a substantial source of nitrate contributing to the high concentrations observed downstream at MH11, the Huron River site at East Cross Street in Ypsilanti. Further evaluations of nitrate loads need to confirm the nitrate contributions from each of the tributaries to the main stem of the Huron River that fuel the eutrophic conditions at MH11 and support harmful algal blooms in Ford and Bellville lakes.
Conductivity
Conductivity values at most sites in the Middle Huron are periodically elevated above the target threshold of 800 µS/cm during the sampling season. The urban sites in the system generally have the highest readings. Allen, Millers, Malletts and Swift Run creeks all have particularly high conductivity values, but so does Honey Creek, even though it is a mixed land use creekshed. Millers, Malletts, and Swift Run creeks have the worst conductivity overall with means and median values consistently above 1000 µS/cm over the period of record and measured values above 2000 µS/cm multiple times over the last five years. The highest values are often observed during periods of low baseflow associated with hot and dry atmospheric conditions, such as the flash drought between May and July 2023.
HRWC has tracked sources of high conductivity and added the measures of chloride and sulfate in 2012 to better characterize sources. The high conductivity levels at Millers, Malletts, and Swift Run creeks coincided with high chloride levels, suggesting potential salt sources. Most chloride concentrations (~75%) at these three sites are above the state aquatic maximum level (320 mg/L) with the highest concentrations observed in Millers Creek. HRWC’s additional source tracking in Millers Creek found that the highest conductivity originated north of Plymouth Road, likely from a previous road salt storage location. Together these findings suggest road salts are a major contributor to high conductivity at these urban sites and are likely impacting aquatic life in these creeks.
Dissolved Oxygen
Most dissolved oxygen concentrations in the Middle Huron tributaries are above the 5 mg/L hypoxic threshold and support aquatic life. On rare occasions low dissolved oxygen has been measured below this threshold at six of all nine monitored tributaries. Swift Run, however, is the only tributary that has experienced low DO since 2015 with two records in 2016, one in 2017, one in 2021, and one in 2023. As a highly urbanized and altered drainage, this site experiences very flashy flows with extremely low or even stagnant baseflows, especially during hot and dry periods, that lead to a decline in DO. For example, DO dropped to 5 mg/L at Swift Run during a flash drought in southeastern Michigan in June of 2023. These low DO conditions are generally short-term, but the combined concerns of low water levels and low DO likely inhibit the ability of biota to survive in the Swift Run creek, and, indeed, Swift Run is listed by EGLE as impaired for low biota diversity.
pH
Tributary pH records differ slightly across sites but tend to be stable over time at individual sites. Only on rare occasions has the pH not met the state water quality standards: 3 values below 6.5 and 3 values above 9. Occurrences of slightly acidic conditions occurred at Honey Creek in 2005 (6.22) and twice at Traver Creek in 2012 (6.0 and 6.45). Occurrences of slightly more basic conditions occurred at Swift Run in 2017 (9.05) and at Malletts Creek in 2021 (9.06). These were all short-term events with no identified specific discharge of acidic or basic substances that would harm humans or aquatic life.
Temperature
The monitoring season occurs during the spring and summer months when water temperatures increase as air temperatures increase. Temperatures in the tributaries are slightly cooler than temperatures in the main stem of the river with cold temperatures between 3 -5°C in early April that warm to between 20 – 25°C in the summer months. Most of the tributary sites are shaded by riparian buffers that help protect their often-shallow waters from overheating. There has only been one occurrence of high water temperatures in Malletts Creek back in 2007. Otherwise, water temperatures have been normal and supportive of aquatic life throughout the Middle Huron tributaries through 2023.
Flow
Stream flow or discharge is measured at all long-term monitoring sites. As stream flow is the most complicated measure to evaluate and impacts most other parameters, it will be addressed in a supplement to this report. Current real-time water level and flow records for some sites can be viewed on the Digital Water Lab Water Level and Flow webpage.
Explore Our Chemistry DataAcknowledgements
Funding Partners & Governments

The Middle Huron Chemistry and Flow Monitoring Program is a project of the Middle Huron Partners. The Partnership is a voluntary watershed-based group of businesses, academic institutions, and local, county and state governments working since 1996 to prevent pollution in the middle Huron River Watershed and meet federal water quality standards for Ford and Belleville lakes. Member governments and agencies include:
Ann Arbor Charter Township
Ann Arbor Public Schools
Barton Hills Village
City of Ann Arbor
City of Belleville
City of Chelsea
City of Dexter
City of Ypsilanti
Northfield Township
Pittsfield Charter Township
Scio Township
Superior Charter Township
University of Michigan – Environment, Health & Safety
Washtenaw County Road Commission
Washtenaw County Water Resources Commissioner
Ypsilanti Charter Township
VA Ann Arbor Healthcare System
Partners and Volunteers
The strength and breadth of the Middle Huron Chemistry and Flow Monitoring Program is made possible by the generous time and effort provided by the over 40 annual volunteers. The Middle Huron Partners and the Huron River Watershed Council would like to sincerely thank the volunteers and leaders for their dedication to the program.
The Middle Huron Partners would also like to thank the City of Ann Arbor Water Treatment Plant Laboratory for providing water sample processing and analysis.
Contact Information
For additional information on the Chemistry and Flow Monitoring Program and results, please contact Kelly McCabe at [email protected].
To become a volunteer in the program, please visit hrwc.org/chemflow.