


Climate Change in the Huron River Watershed
Climate change is evident in the Huron River watershed already. Average temperatures are warmer and we have more intense rainfall events. Models that predict future trends indicate that these increases will continue. The changes affect the plants, fish, and other aquatic organisms that help keep our rivers healthy and clean. The increases also affect the built environment and watershed residents. HRWC works to build resilience in the natural and built environment in order to minimize the impacts of global climate change.
Here are several resources for people interested in learning more about how the climate is changing locally.
- Climatology for the Ann Arbor Station – a summary of historical data to share climate trends from Ann Arbor’s weather station
- Climatology for Southeast Michigan – a summary of historical data to share climate trends in SE Michigan
- Climate Change in the Great Lakes Region – a look at both historical and projected future data for the entire Great Lakes Region
The below fact sheets summarize the impacts of climate change on infrastructure, natural resources and public health.
- Impacts of Climate Change on Infrastructure
- Climate Change Impacts on Natural Resources
- Impacts of Climate Change on Public Health
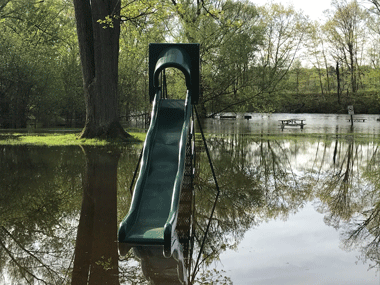
Understanding Flood Risk
Each year we are experiencing 16% more precipitation than we used to in Michigan. A lot of this extra rainfall is occurring in more extreme events. In the Midwest our largest storms have rainfall volumes 43% greater than historical measurements. HRWC worked with a University of Michigan research team to understand how risk of flooding may change based on different future climate scenarios.
Impacts from more rain or snow in our area are many. Flooding is an obvious one, whether it be river flooding or road or basement flooding. But consider also what that water may be carrying. We have many known sources of environmental contamination from brownfield sites to buried gas tanks. Flood waters can pick up these toxics and move them around which increases the impact of flooding. Further, some groups may be more vulnerable to impacts from flooding. For example, the elderly may have a harder time leaving their home quickly due to a flood emergency or those who do not speak English as a first language may not receive warnings.
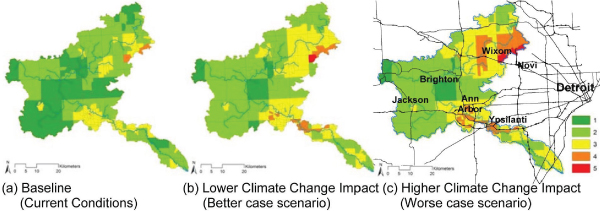
The map below shows an index of three factors: predicted future flood risk, density of environmental hazards or toxics, and social vulnerability. This map represents a potential future and can therefore help us think about places in our watershed where we may want to take actions and the best actions to take in order to prepare for increased flooding.
Additional resources
- Some of the best and most accessible information on climate change for our area is produced by GLISA
- The most comprehensive and respected national resource on climate change is the Fourth National Climate Assessment
*Cheng, C., Tsai, J-Y, Yang, E. Y-C, Esselman, R., Kalcic, M., Mohai, P., & Xu, X. (2017). Risk communication and climate justice planning: A case for Michigan’s Huron River watershed. Urban Planning Journal Special Issue: Social Ecology of Sustainability. Vol 2(4) p34-50. doi: 10.17645/up.v2i4.1045