


In 2017, HRWC created InfoStream, a storymap for sharing the Huron River watershed’s ecological information and water quality data. Since then, the tool has been used by thousands of anglers, schoolteachers, partner organizations, volunteers, and residents looking to know more about their local waterbodies. However, the time has come for a revamp!
We asked our volunteers, donors, and partners what they use our InfoStream tool for, and what information they wanted to have. The answer was: a lot!
In response, our new and improved InfoStream tool hosts a gallery of maps that can be accessed by topic. Before InfoStream was one big map. Now, with the gallery approach, we are still sharing that data but in ‘bite-sized pieces’ for easier navigation. And we added maps from partners since we know they have information our visitors want.
Improving Water Quality Data Accessibility
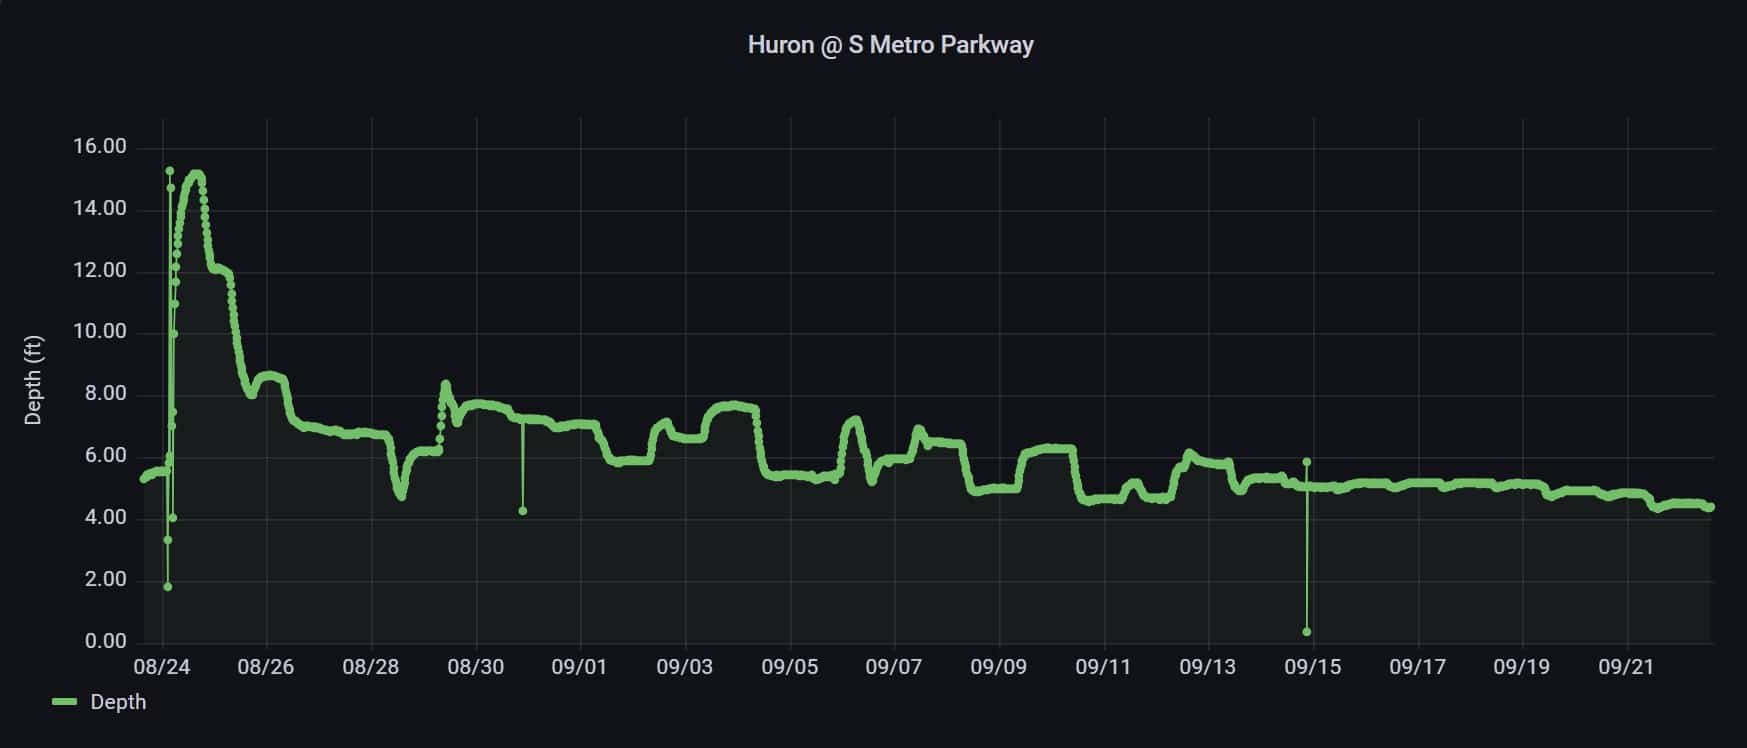
By launching InfoStream 2.0, we are making HRWC monitoring data more accessible. For example, the new Benthic Macroinvertebrates Dashboard allows you to view and download insect data from all 30 years of collection. The Water Chemistry Dashboard allows you to access data on phosphorus, E. coli, dissolved oxygen and more, collected by volunteers as part of our chemistry and flow monitoring program. For water-level data, InfoStream links to our partners at the University of Michigan Digital Water Lab who have real-time water depth and discharge data from sensor nodes placed in streams throughout southeast Michigan.
More critters!
The consensus we came to when developing InfoStream 2.0 was: people love critters! So, we added multiple tools that let you explore information about our non-human neighbors. Anglers and fish enthusiasts can now view a map containing data from fish samples taken by the University of Michigan and MI Department of Natural Resources. This is a great tool for figuring out the best spot to find certain species, or just to learn more about local fish. And there is more to come! Keep an eye out for a map containing the results of our pilot mussel monitoring program.
Public health
Environmental and public health are deeply intertwined. Improving the health of the Huron River benefits both public health and the river’s natural ecosystems. With the launch of InfoStream 2.0, we have added multiple maps that contain location-specific information on various public health issues. Our drinking water map allows you to search by address to find the source of your drinking water and access drinking water quality reports. You can also click on the Contaminants map to see exactly where the Michigan Department of Environment, Great Lakes, and Energy (EGLE) is sampling for and finding PFAS. Through the InfoStream page you can also access EGLE’s MiEJScreen, which is a web map that scores census tracts for various environmental, health, and socioeconomic indicators to measure relative environmental risk factors in communities.
Knowing where you live
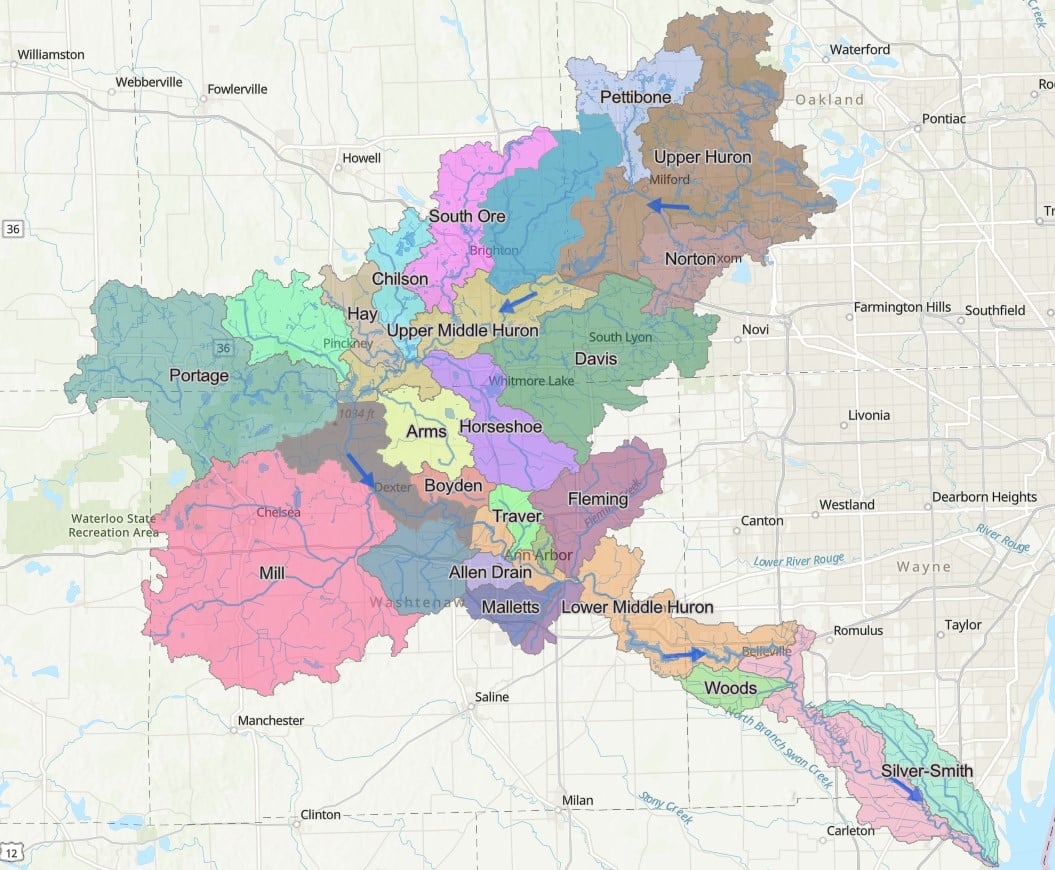
Did you know the Huron River watershed is made up of 22 sub-watersheds called creeksheds? Each of these creeksheds has its own history, environmental and water quality challenges, and hydrologic characteristics. Our map lets you find out what creekshed you live in and learn its story. We also encourage you to learn about the past and present indigenous areas including names of native groups and nations, links, treaties, and languages.
On behalf of the InfoStream team, I hope you take a stroll through the new InfoStream gallery and see what you can discover! This tool is designed for growth and adaptation, so let me know what you think by emailing me here.