MAP OF NATURAL AREAS IN HURON RIVER WATERSHED

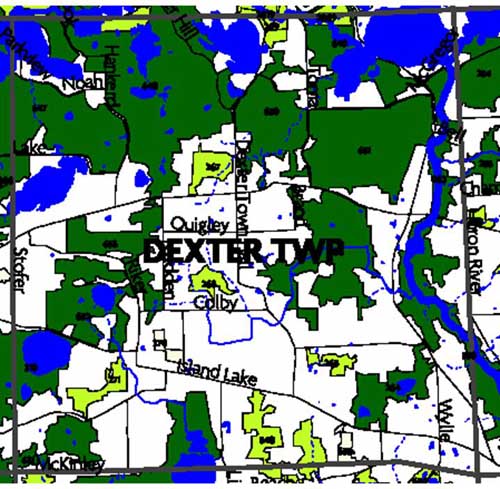
In order to provide local communities, land conservancies, and other interested organizations with information about the location and value of our remaining natural areas, HRWC has completed a “Bioreserve Map” that ranks the areas based on the ecological services they provide. HRWC used aerial photographs taken over Oakland, Livingston, Wayne, Washtenaw, and Monroe counties to create the map. We drew boundaries around areas on the photographs that appeared to be woodland, wetland, or open field and mapped nearly 1,700 sites, for a total of 237,000 acres (out of about a million acres of total land) in the watershed. Once the map of the areas was complete, staff worked with faculty and students at the University of Michigan School of Natural Resources and Environment to develop a computerized model to rank them.
The ranking criteria include:
- Size
- Whether wetlands are on the site
- Whether rivers or lakes are on the site
- The potential for the site to contain groundwater recharge areas
- The potential for the site to harbor a high diversity of ecosystems (determined indirectly by measuring diversity of the site’s geology and topography)
- The potential presence of high value remnant ecosystems such as lakeplain prairie


Funding to preserve natural areas is limited. The map provides one tool for prioritizing funding to preserve the best natural areas first, before encroaching development engulfs them forever. Programs like the City of Ann Arbor’s Greenbelt millage, where communities are attempting to save the best natural areas through purchase of development rights or outright acquisition, will find the map useful. Other communities have used a similar map that Livingston County Planning Department staff adapted from the HRWC map to enact ordinances to require a permit before development in the areas occurs.
Download the Bioreserve map here.
The Table of Scores and Rankings lists all the Bioreserve Sites, their total score and scores for each ecological criteria, and how they ranked overall and for each ecological criteria.
- Table of Scores and Rankings, xls file, 656kb
- Table of Scores, pdf 259kb
- Table of Rankings, pdf 187kb

The Bioreserve Map was created using Geographic Information Systems (GIS) Software, ArcView and ArcGIS Desktop, which was provided through ESRI’s Conservation Support Program.
Bioreserve scores explained, 2007 59kb, explains how HRWC created the scores and rankings.


