
In January, HRWC staff and volunteers got together to celebrate another successful season of data collection. Call it a Water-Nerd-Fest, if you like, as we all geeked-out on the results from this year’s monitoring. The new twist this year was structuring our findings to focus on different tributary “Creeksheds,” similar to the way we have developed Creekshed Reports. Using that framework, we took volunteers on a tour of the watershed from the mouth at Lake Erie to the river’s named origin flowing out of Big Lake.
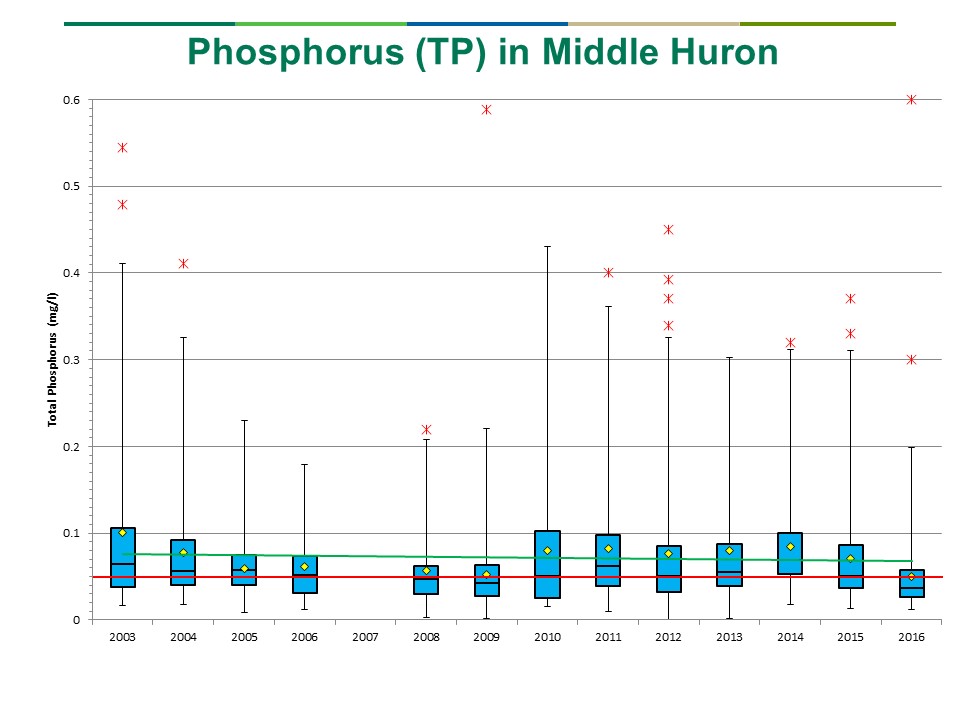
Stevi Kosloskey and I talked about results from the Water Quality Monitoring Program, in which we sample stream water chemistry and track stream flows. The results from 2016 and past years really provide a tale of three different watersheds: the lower section is characterized by lots of developed land which corresponds with generally poorer water quality. The middle section also has some development, but is also mixed with forest and agriculture lands, and much effort and resources have been invested in treating urban runoff (see Summer 2016 and 2015 newsletter articles for more detailed analysis of the impacts of those investments). Subsequently, we saw our lowest phosphorus concentrations from that region in 2016 and the bacteria levels are strongly declining as well. Upstream in the Chain of Lakes region, there is much less development and large areas of protected lands, and we see generally better water quality, though there are signs of decline to keep our eyes on.
We also discussed findings from River Roundup, habitat and Bioreserve programs. Sign-up to volunteer for these in 2017 so you can join the fun, learn more about the watershed, and get your science geek on!